Public Release of Observation Data
(Radiance Spectrum and Images)
from "IBUKI" Greenhouse gases Observing SATellite (GOSAT)
Japan Aerospace Exploration Agency (JAXA)
National Institute for Environment Studies (NIES)
Ministry of the Environment (MOE)
The Level 1 data products, which are radiance spectra observed by TANSO-FTS and images by the TANSO-CAI onboard the Greenhouse gasses Observing SATellite "IBUKI", will begin to be released to general users following the completion of the initial calibration.
In the future, after further calibration and validation of the data, the atmospheric concentration of carbon dioxide and methane data and corresponding analyzed products will be made available to registered users among the general public from around the end of January, 2010 target period.
[How to access the data]
First, visit the Internet website of the GOSAT observation data distribution and observation request service "GOSAT User Interface Gateway (http://data.gosat.nies.go.jp/)" provided by the National Institute for Environmental Studies (NIES) and register your information. You can then download observation data whenever and wherever you want.
* For the moment, the radiance spectrum data observed by TANSO-FTS available will be ones generated after October 29, 2009.
* Earth observation image data observed by TANSO-CAI, for which the initial calibration process has been completed, will be provided soon (scheduled for mid-November, 2009) after confirming the processing and distribution system.
[Contact regarding each Level 1 product]
Earth Observation Research Center (EORC)
Space Applications Mission Directorate
Japan Aerospace Exploration Agency
Phone: +81-50-3362-3064
(Level 1B product of TANSO-CAI)
GOSAT Project Office
Center for Global Environmental Research
National Institute for Environmental Studies
Phone: +81-29-850-2966
|
|
Attachment: The released IBUKI data for registered users among the general public
An initial calibration process of Level 1B products (the radiance spectra)(Note 1) obtained by the main observation instrument TANSO-FTS onboard the satellite IBUKI, has been completed. Since the data is ready for release, it will be provided to general users from October 30, 2009.
Those who are interested in obtaining the data are requested to register themselves via the website of the NIES. Registered users can download the data at any point and any time from the database. For the time being, only observation data obtained after October 2, 2009, is provided. For user registration, an email address is required.
Homepage regarding the data release: http://data.gosat.nies.go.jp/
An initial calibration of the earth observation image data (Note 2) obtained by the Cloud and Aerosol Imager (TANSO-CAI) has been completed as well. Since the data is ready for release, it will be offered to general users. The release is scheduled in the middle of November, 2009.
(Note 1) The light intensity of sunlight reflected from the earth's surface or thermal radiation emitted from the atmosphere at each wavelength. Gases in the atmosphere indicate absorption of its specific wavelengths, and an abundance of gases is calculated from its spectral absorption feature.
(Note 2) Image data captured by a CCD camera facing the earth. Geographical information as well as cloud coverage can be observed.
(1) Examples of Level 1B product (Radiance spectrum) of TANSO-FTS
The Level 1B product of TANSO-FTS, which will begin to be provided, is composed of the spectrum of Band 1-4 as shown in Table 1. For Bands 1-3, P- and S-polarized spectrum as polarization spectrum data(Note 3) will be provided.
(Note 3) The light has "polarization" in nature, in addition to wavelength (color), intensity (brightness). The "Ibuki" observes the S and P orthogonal polarization components. Variability of polarization is used due to properties of the surface, and the state of atmospheric aerosols and thin clouds when atmospheric concentrations are derived from observation data.
Figure 1 shows Band 1-4 radiance spectra of TANSO-FTS, which were observed on April 23, 2009, over Tsukuba, Japan (Band 1-3 has P- and S- polarized spectrum). The horizontal axis is wavelength (microns), the vertical axis is spectral radiance (light intensity of each wavelength). The absorption of greenhouse gases in the observed spectrum with each band can be seen.
Figure 1: Examples of radiance spectra that were observed on April 23, 2009, at Tsukuba, Japan
CO2 and CH4 concentrations are derived by analyzing these radiance spectral data. By accumulating this data, global maps of XCO2 and XCH4, column averaged dry air mole fraction (Note 4) of CO2 and CH4, are obtained. As examples, Figure 2 is a global map of XCO2 (unvalidated) for the month of September 2009 and Figure 3 is that of XCH4 (unvalidated). It should be acknowledged that the current results are unvalidated and consequently it is not appropriate to interpret estimated individual column averaged dry air mole fraction values. After initial validation activities and adjustments of corresponding data processing methods, the concentration data will be made available for the registered general public from around the end of January, 2010 target period.
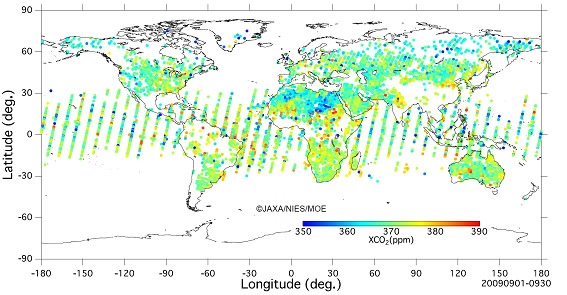
Figure 2: Column averaged dry air mole fraction distribution of carbon dioxide
for the month of September, 2009, obtained from IBUKI observation data (unvalidated)
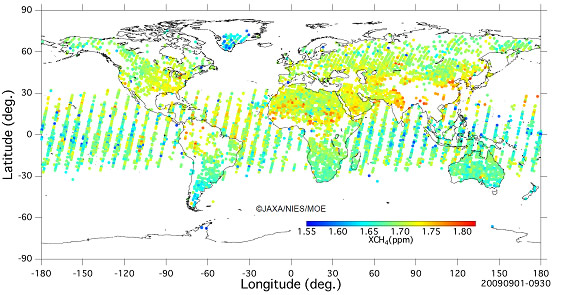
Figure 3: Column averaged dry air mole fraction distribution of methane for the month of September, 2009,
obtained from IBUKI observation data (unvalidated)
(Note 4) Column averaged dry air mole fraction: The fraction of moles of a particular component of air divided by the total number of moles of gas in the same sample bound by a vertical column extending to the upper air, and not just on the ground surface.
(2) Examples of Level 1B image of TANSO-CAI
Specifications of TANSO-CAI are shown in Table 2. One strip (Note 5) data (about a half round of GOSAT around the earth) of TANSO-CAI is divided into frames (Note 6), which is corrected band-to-band registration based on the sensor coordinate of Band 3 without interpolation among pixels. Figure 4 shows a TANSO-CAI sample image of the JAPAN area by allocating Band 1 in blue, Band 2 in red, and Band 3 in green, respectively.
(Note 5) Strip: A string of data along an orbital path in the daytime, which is about 1,000 km in width.
(Note 6) Frame: A unit of sixty parts of one orbit. There are about 30 frames of daytime data. Level 1B and Level 1B+ products are provided in the frame unit.
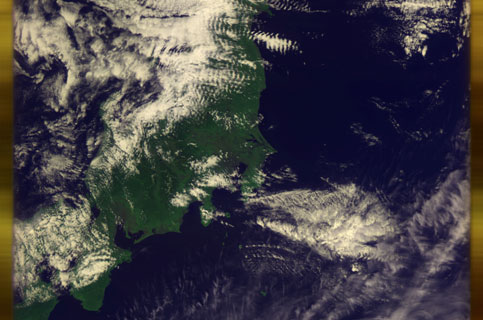
Figure 4. An Example of TANSO-CAI Level 1B image on April 23, 2009, over the Kanto region, Japan
(Color composite image, green: Band 3, red: Band 2, blue: Band 1)
Level 1B+ product of TANSO-CAI is in a frame unit, which is the same as Level 1B by processing of interpolation, map projection and corrected band-to-band registration. The image is arranged so the upper direction indicates the north. Figure 5 shows a TANSO-CAI sample image of JAPAN area by allocating Band 1 in blue, Band 2 in red and Band 3 in green, respectively.
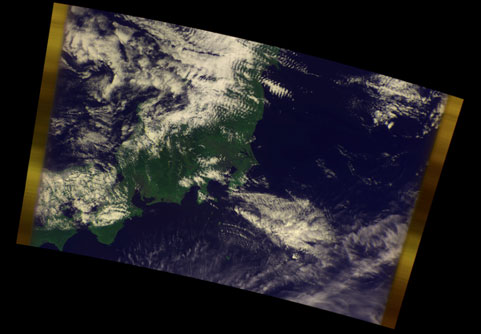
Figure5. An Example of TANSO-CAI Level1B+ image on April 23, 2009 over Kanto region, Japan
(Color composite image, green: Band 3, red: Band 2, blue: Band 1)