On the public release of carbon dioxide flux estimates
based on the observational data by
the Greenhouse gases Observing SATellite "IBUKI" (GOSAT)
National Institute for Environmental Studies (NIES)
Ministry of the Environment, Japan (MOE)
Japan Aerospace Exploration Agency (JAXA)
The Greenhouse gases Observing SATellite "IBUKI" (GOSAT), developed jointly by the Ministry of the Environment Japan, the National Institute for Environmental Studies, and the Japan Aerospace Exploration Agency (hereinafter the Three Parties), is the world's first satellite designed specifically for monitoring atmospheric carbon dioxide (CO2) and methane (CH4) from space. The satellite has been in operation since its launch on January 23, 2009.
The Three Parties will now publicly distribute the data of global CO2 fluxes on a monthly and regional basis for the one-year period between June 2009 and May 2010. These flux values were estimated from ground-based CO2 monitoring data and improved GOSAT-based CO2 concentration data.
It has been confirmed that uncertainties in CO2 flux estimates can be reduced by the addition of GOSAT data to the ground-based observations. This is the first concrete demonstration of the utility of satellite-based concentration data in the estimation of global CO2 fluxes.
It is expected that this progress in the field of global carbon cycle research will lead to more reliable climate change prediction and to the development of effective environmental policies for mitigating global warming in the future.
In order to obtain better CO2 flux estimates, the Three Parties will continue the effort of refining the data processing algorithms for the retrieval of CO2 concentrations from GOSAT data and the estimation of CO2 fluxes.
1. Summary of the data product release
(1) Net CO2 flux estimatesThe Three Parties will publicly distribute the monthly estimates of net CO2 fluxes (Note 1) for 64 sub-continental regions from June 2009 to May 2010. These flux values were estimated from the global distribution of CO2 concentration retrieved from GOSAT observational data and ground-based CO2 monitoring data (Note 2), using an atmospheric tracer transport model (Note 3) and a Bayesian inverse modeling scheme (Note 4). Further explanations of the net CO2 flux estimation technique are found in the appendix to this document (attached). As examples, the net CO2 fluxes for July 2009 and January 2010 are presented in Figure 1.
July 2009
January 2010
Net CO2 fluxes in 64 regions (left) and their uncertainties (right) estimated from both ground-based monitoring data and GOSAT data. Results for July 2009 (summer in the Northern Hemisphere) and January 2010 (winter in the Northern Hemisphere) are shown. The upper and lower color-coded scales are for land and oceanic regions, respectively. Positive values indicate net emission, and negative values show net absorption. Unit: gC/m2/day (see Note 5 for explanation).
(2) Reduction of uncertainties in flux estimates
It has been confirmed that uncertainties in CO2 flux estimates can be reduced by as much as 40% (annual average) by adding GOSAT data to the ground-based monitoring data. In particular, uncertainties of CO2 fluxes estimated for regions that are not covered by the ground-based monitoring network (e.g. the western seaboard regions of central Africa, southeastern Africa, the Middle and Near East, and India) were reduced by 20-30% (Figure 2). With these reduced uncertainties, it is now possible to determine whether these poorly-sampled regions act as net sinks or sources (Note 6) of CO2.
Rate of reduction in the uncertainty of monthly surface CO2 flux estimates, achieved by adding GOSAT data to ground-based monitoring data. The values shown are annual means over the analysis period from June 2009 to May 2010.
(3) Simulation of CO2 distribution in the three-dimensional space
Based on the above-mentioned CO2 flux estimates, global three-dimensional CO2 distributions have been simulated. These CO2 maps will now also be released to the general public. It should be noted that these are the products of model simulations and include uncertainties intrinsic to modeling (the results and more details can be found in the appendix). The simulation results will be viewable at the NIES GOSAT Project website. (URL: https://data.gosat.nies.go.jp/ - Click on "Gallery" in the left column to access the figures.)
2. Next steps
(1) Expanding temporal coverageCO2 flux estimates for 64 regions will be released for the period extending from June 2009 to May 2010 at this time. This time interval will later be extended to May 2011. The extended results will then be released to affiliated researchers, selected by means of GOSAT Research Announcements for Principal Investigators, in order for these estimates to be evaluated and verified. In addition, we will evaluate the accuracy and consistency of the results by means of comparisons with independent flux estimation results from other research groups. After the evaluation mentioned above, the extended data product will be released to the general public.
Additional information: development of a GOSAT follow-on mission
To further improve the accuracy of global flux estimates, the capability of global, space-based greenhouse gas observation must be enhanced. Today, GOSAT is the only satellite making these observations. This year, the Three Parties have begun the process of developing GOSAT-2, a GOSAT successor with enhanced observing capabilities, aiming for a launch in 2017.
In developing GOSAT-2, the Three Parties also plan to refine the data processing algorithms used to analyze the satellite observational data and to estimate CO2 fluxes.
As space missions similar to GOSAT-2 are being planned and implemented by the U.S. and by other nations, the Three Parties will seek to broaden the international cooperation on space-based greenhouse gases observation.
Notes
- 1) Difference between the sum of CO2 emissions (anthropogenic emissions, wildfire emissions, and respiration by soil and terrestrial plants) and that of absorptions (uptake by terrestrial plants and oceans) on a regional basis.
- 2) Ground-based CO2 network data provided by the U.S. National Oceanic and Atmospheric Administration (GLOBALVIEW-CO2). Data available online at http://www.esrl.noaa.gov/gmd/ccgg/globalview/index.html.
- 3) A computer program for modeling the transport and diffusion of atmospheric trace gases such as CO2 and CH4. The program is used to simulate spatial and temporal changes in the distribution of those gases. An atmospheric tracer transport model developed at NIES was used for this analysis. For the atmospheric transport simulations, the JCDAS meteorological data provided by the JRA-25 long-term reanalysis project, promoted by the Japan Meteorological Agency and the Central Research Institute of Electric Power Industry, were used.
- 4) A scheme based on Bayes' rule to infer parameters from observational data. Detailed explanations on the data processing algorithm can be found in a peer-reviewed paper by Maksyutov et al. (2012): Regional CO2 flux estimates for 2009-2010 based on GOSAT and ground-based CO2 observations, Atmos. Chem. Phys. Discuss., 12 29235-29288, doi: 10.5194/acpd-12-29235-2012.
- 5) gC/m2/day: a unit for net CO2 flux. It expresses the net amount of CO2, converted into the amount of carbon, exchanged in one square meter of surface in one day.
- 6) Sources and sinks of CO2: Sources are processes that emit CO2 into the atmosphere. Sinks are processes that absorb CO2 from the atmosphere.
|
|
On the estimation of regional CO2 fluxes from GOSAT data and the simulation of three-dimensional CO2 concentration distributions based on the flux estimates
The GOSAT Project, a joint undertaking of the Ministry of the Environment Japan, the National Institute for Environmental Studies, and the Japan Aerospace Exploration Agency, has been providing the general public with the global distribution data of CO2 concentrations (column-averaged dry air mole fractions of CO2, hereafter referred to as XCO2) retrieved from GOSAT data obtained over clear-sky regions. The XCO2 retrievals were updated in June 2012 and the data have been made available to the general public as version 2 of the GOSAT FTS SWIR Level 2 data product. Through comparison with reference data obtained with high-resolution Fourier transform spectrometers installed at ground-based observational sites, the mean and standard deviation of the differences (biases) were found to be -1.2 ppm and 2.0 ppm, respectively, which are much smaller than the corresponding values for version 1 data product. The number of the concentration data also increased by 30 to 50% (depending on the season) compared to the version 1 data product.
Researchers of the Project estimated regional CO2 fluxes from the improved GOSAT XCO2 retrievals and from data collected by networks of surface CO2 monitoring stations, via inverse modeling. Until recently, regional CO2 fluxes were inferred from the ground-based network data obtained at about 200 monitoring stations around the globe. Since many of the monitoring stations are located in the developed nations, the uncertainties of fluxes estimated for regions located far from the monitoring networks were sizable. The researchers confirmed that these uncertainties were reduced by using the GOSAT XCO2 retrievals. The regional CO2 flux estimates and their uncertainties calculated for twelve months from June 2009 to May 2010 will now be made available to the general public as the GOSAT Level 4A data product.
- Method of CO2 flux estimation
CO2 fluxes for 64 regions of the globe (Figure 1, left) were estimated on a monthly basis from both the GOSAT XCO2 retrievals and ground-based CO2 monitoring data (GLOBALVIEW-CO2; hereafter referred to as GV). The locations of the GV monitoring stations are shown on the right panel of Figure 1. Gaps in the ground-based monitoring network are found in South America, Africa, Middle and Near East, and Asia. Prior to their use in the inverse modeling process, the weekly GV values were converted into monthly means. The GOSAT XCO2 retrievals, after correcting their biases by adding 1.2 ppm to all XCO2 values, were gridded to 5° ×5° latitude-longitude grids and averaged on a monthly basis.
As examples, the GV values and the bias-corrected GOSAT XCO2 retrievals for July 2009 and January 2010 (summer and winter in the Northern Hemisphere, respectively) are displayed in Figure 2. These two panels show that GOSAT XCO2 retrievals successfully fill out the gaps in the ground-based monitoring network, except for the high-latitude regions of the Northern Hemisphere where local solar zenith angles are low, and for regions that are frequently covered by clouds and aerosols.
Figure 3 shows the regional CO2 flux estimates and their uncertainties for these selected months. It should be noted here that with the computation scheme used, the July and January fluxes were estimated not only from observations in the corresponding months but also from neighboring months. The results for July, during which the photosynthetic activity of terrestrial plants in the Northern Hemisphere is high, show that many regions in the Northern Hemisphere are net sinks of CO2 (indicated with green color). Most of these regions in January, during which the plant photosynthesis is generally weak in the Northern Hemisphere, are shown to be net sources of CO2 (red color). Region #20 (Figure 1, left) is mostly desertic and its net CO2 balance throughout the one-year period was estimated to be nearly zero.
Figure 1.
Left: Boundaries of the 64 regions used for inverse modeling. The numbers embedded in the figure are region IDs. Regions in dark blue are not considered in the flux estimation. Right: locations of the ground-based monitoring stations (red dots; including airborne and ship-based sites) whose data were used in this analysis.
Figure 2.
5° × 5° gridded GOSAT XCO2 retrievals (squares) and ground-based GV concentrations (circles) used as input for the inverse modeling (monthly means). Left: July 2009 (summer in the Northern Hemisphere). Right: January 2010 (winter in the Northern Hemisphere).
Figure 3.
Fluxes (upper panels) and uncertainties (lower panels) estimated for 64 regions. Left: July 2009 (summer in the Northern Hemisphere). Right: January 2010 (winter in the Northern Hemisphere). - Evaluating the utility of GOSAT data
(1) Uncertainty of flux estimates
To evaluate the utility of GOSAT XCO2 retrievals for regional flux estimation, CO2 fluxes and their uncertainties for the 64 regions over the one-year period were inferred from
1) GV data only and
2) both GV data and GOSAT XCO2 retrievals.
Here, the utility was evaluated based on the rate of reduction in flux uncertainty (UR) in percent. It is expressed as,
where σGV and σGV+GOSAT denote the uncertainty of a monthly flux value estimated from GV data only and from both GV data and GOSAT XCO2 retrievals, respectively. Flux estimates associated with larger UR values are considered to be better characterized if the GOSAT XCO2 retrievals are used in the analysis.
(2) Uncertainty reduction
It was confirmed that through the addition of GOSAT XCO2 retrievals to the GV data, the uncertainties of monthly flux estimates for the poorly-sampled regions of the ground-based monitoring network (e.g. South America, Africa, Middle and Near East, and Asia) were reduced by as much as about 60%. Figure 4 shows annual mean UR values for the 64 regions. The maximum annual-mean reduction rate was approximately 40%.
Figure 4.
The rate of reduction in the uncertainty of monthly CO2 flux estimates, achieved by adding GOSAT XCO2 retrievals to GV data. The values shown are annual means over the June 2009-May 2010 analysis period.
As an example, flux estimates and flux uncertainty reduction for two regions, Middle and Near East (Region A in Fig. 4) and north-western temperate North America (Region B in Fig. 4), are contrasted here. Regions A and B represent locations where the ground-based monitoring stations are sparse and dense, respectively. In Figure 5, the time series of monthly fluxes and their uncertainties estimated from GV data only and from both GV data and GOSAT XCO2 retrievals are presented. The solid lines in the figure show fluxes estimated from GV data (red) and from both GV data and GOSAT XCO2 retrievals (blue). The vertical bars (gray) indicate monthly uncertainty reduction rates (values are shown on the right axis). The green line and the green shaded area show the value of the a priori flux and uncertainty used in the inverse modeling. The a priori flux estimates are based on the inventories of anthropogenic emissions and wildfire emissions, and on model-simulated estimates of CO2 exchange by terrestrial vegetation and oceans.
The GV-based monthly fluxes inferred for Region A (Middle and Near East) are associated with large uncertainty (red error bar) since the estimation of the fluxes is based on measurements taken far from this region. By adding the GOSAT XCO2 retrievals to the GV data, the uncertainty of the fluxes was reduced significantly (blue error bar). In contrast, a relatively large number of ground-based monitoring stations are located within and nearby Region B (north-western temperate North America). In addition, the data obtained at the ground-based monitoring stations have higher precision than the GOSAT XCO2 retrievals. Therefore, they have a larger influence on the determination of the region's flux values. Because of this, the fluxes and their uncertainties estimated from GV data only and from both GV data and GOSAT XCO2 retrievals are nearly identical over the analysis period.
In this inverse modeling analysis, the anthropogenic and wildfire emissions were both treated as known, and the CO2 exchanges by terrestrial vegetation and oceans were optimized. Therefore, the changes in the flux estimates from red to blue seen in Figure 5, which are associated with larger uncertainty reduction rates, are considered as the result of the flux optimization by the additional information brought by GOSAT observations. For instance, the flux estimates for region A suggests that uptake in June 2009 and release in March and April 2010 by the terrestrial vegetation of this region were both smaller than what were estimated from the ground-based data only, even when the range of uncertainty was taken into account.
The above instance demonstrates that flux estimates for remote regions, located far from the ground-based monitoring stations and thereby associated with large uncertainties (e.g. the western seaboard regions of central Africa, south eastern Africa, Middle and Near East, and India) can be improved if the GOSAT XCO2 retrievals are used in the analysis.
Figure 5.
Time series of monthly fluxes and their uncertainties estimated from GV data only (red) and from both GV data and GOSAT XCO2 retrievals (blue). The vertical bars (gray) indicate monthly uncertainty reduction rates (values are shown on the right axis). The green line and the green shaded area show the values of the a priori flux and its uncertainty used in the inverse modeling. Upper panel: Middle and Near East (Region A in Figure 4; south western temperate Asia). Lower panel: north western temperate North America (Region B in Figure 4).
It should be noted, however, that these results are dependent on the quality of GOSAT XCO2 retrievals. Currently, GOSAT-based XCO2 values are also retrieved at several research institutes other than the National Institute for Environmental Studies. Figure 6 shows the mean and spread (one standard deviation) of the flux estimates for regions A and B based on five independently-retrieved XCO2 datasets. The green line and the shaded area show the mean and spread. The blue solid line shows the flux estimates based on the GOSAT Level 2 XCO2 retrievals. The spread suggests that flux values can vary depending on which XCO2 dataset is used for the flux estimation, and that there is still room for further improvement of the XCO2 retrieval algorithms.
Figure 6.
Mean (green solid line) and spread (green shade) of flux estimates for Middle and Near East (Region A in Figure 4) and north-western temperate North America (Region B in Figure 4) based on five independently-retrieved XCO2 datasets. The blue solid line shows the flux estimates based on the GOSAT Level 2 XCO2 retrievals. The same inverse modeling scheme and a priori data were used for processing each of the five XCO2 datasets.
The flux estimates obtained at this time are based on the assumption that the bias in the GOSAT Level 2 XCO2 retrievals is uniform throughout the globe and over the one-year analysis period. The flux estimates may change with further research. - Three-dimensional simulation of CO2 concentrations based on the monthly flux estimates
The global distribution of CO2 concentrations in the three-dimensional space can be modeled by using the calculated CO2 flux estimates. The outcome of such simulation, the six-hourly CO2 concentration on 2.5 degree latitude-longitude grid at 17 vertical levels, will be distributed to the general public as the GOSAT Level 4B data product.
Figure 7 presents the distribution of simulated CO2 concentrations (monthly average) at an altitude of approximately 5000 m. Results for July 2009 and January 2010 are shown. The influence of anthropogenic and wildfire emissions are considered in the simulation. These simulation results are expected to be used for carbon cycle studies in regions where neither ground-based CO2 observations nor GOSAT XCO2 retrievals are available. The simulated CO2 concentration is affected by some uncertainty, and should be verified through comparison with ground-based reference values.
The simulation results can be viewed at the NIES GOSAT Project website. (URL: https://data.gosat.nies.go.jp/ - Click on "Gallery" in the left column to access the plots).
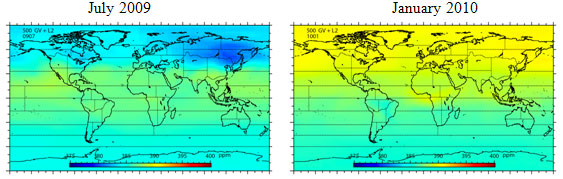
Figure 7.
Distribution of simulated CO2 concentrations (monthly average) at an altitude of approximately 5000 meters. Left: July 2009 (summer in the Northern Hemisphere). Right: January 2010 (winter in the Northern Hemisphere). These are simulation results based on the CO2 flux estimates obtained and are affected by some uncertainty.