Publication of Higher Level Products of AMSR-E
National Space Development Agency of Japan
Regarding data acquired from the Advanced Microwave Scanning Radiometer (AMSR-E) aboard the US earth observation satellite "Aqua", the National Space Development Agency of Japan (NASDA) began to distribute the high level products including sea surface temperature, water vapor and so on to the general users on September 19, 2003, followed by the part of the basic products (brightness temperature) which had already been available to use from June 18, 2003.
AMSR-E is a sensor with its main purpose to quantitatively observe geophysical volume of water every day. It is expected to elucidate the global situation of water and energy circulations, as well as to contribute to the improvement of the accuracy of weather forecast.
The high level products means the converted geophysical parameters to be available for direct use and study by combining brightness temperatures obtained from multiple observation frequency bands. This time, five parameters are ready for distribution such as sea surface temperature, sea surface wind speed, water vapor, precipitation and sea ice concentration.
For further information on the outlines, and categories of data to be provided, and contact person, please click the following web sites:
- For Information on Aqua/AMSR-E, Earth Observation Center
- For Homepage of Aqua/AMSR-E, Earth Observation Research Center
[Examples of AMSR-E Data]
Heat Wave Over the Europe Summer 2003
AMSR-E 10V 2003 minus 2002 during Aug. 10-15 (Kelvin)
Explanation of the Above Data
In summer 2003, most parts of Europe suffered the unusually hot weather. The above data shows the difference in the meanscore of brightness temperature during Aug. 10-15 between 2002 and 2003 observed by AMSR-E (aboard the US earth observation satellite, "Aqua") which was developed by NASDA. It mainly indicates the earth surface temperatures due to the low frequency band (10GHz), but it also seems to reflect the air temperatures. The areas where the figures become plus indicate high temperature in 2003. In particular, orange and yellow colors covering most part of the areas including France, Germany, Czech and the northern part of Italy show that the temperature there became 10 degrees higher than that of last year. The locally redden areas in France and the north part of Italy don't reflect the real temperature. Iit is rather considered that noises show up there, caused by disturbance of the radiowave from the ground which happens to have the same frequency as AMSR-E observation frequency.
Application of AMSR-E Sea Surface Temperature to Fishery
AMSR-E SST by Shibata Algorithm
Explanation of the Above Data
The upper data shows the distribution of average global sea surface temperature for Sep. 3-5, 2003. It is possible to obtain a distribution map with all-day-long coverage, since the microwave techniques can observe sea surface temperature regardless of clouds.
The lower is a combined data with sea surface temperature distribution and fishing grounds near Japan, which was analyzed by Japan Fisheries Information Service Center. A blue marker indicates the location of bonito fishing boat and a red one is the location of saury catching boat. They show the different locations from each other, since the mackerel pike live in the Oyashio Current which is a cold current, and the bonito live in the Kuroshio Current which is a warm current. Moreover, you can see that fishing grounds concentrate on the thrusting part of the warm water and the location where the color (water temperature) suddenly changes (current rip).
Using temperature data from the satellite, It is expected to make fishermen easier to find appropriate fishing grounds for what they wish to catch and to ensure them efficient fishing operation.
As a result, AMSR-E encourages its data to be applied further to the fishery sector, since its cloud-penetrating technique can obtain continuous sea surface data, including the areas of further north from 38 degrees north where TRMM/TMI could not observe.
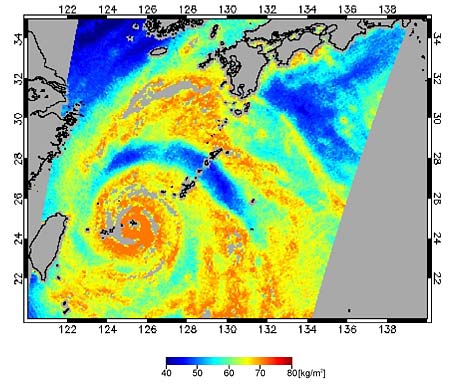
Typhoon No. 14 Observed by AMSR-E
Observation of Typhoon No. 14 by AMSR-E
Assumption of Precipitation
AMSR-E spotted Typhoon No.14 which approached near Miyakojima Island and caused serious damages there. This data indicates the assumption of precipitation (left) and water vapor (right) based upon the analysis of observation data from AMSR-E. As the color on the map changes from blue to red along the color bar below, it means that precipitation becomes heavier and humidity becomes higher. It can be found that heavy precipitation surrounds the center of the Typhoon. In addition, the water vapor data shows that the Typhoon No.14 is already giving an impact to the Kyushu district.
Water Vapor
Explanation of the Above Data
There has been a very few observation data available about precipitation and water vapor on the sea. It is, therefore expected that the application of observation data by AMSR-E into numerical models would contribute to improving the accuracy of weather forecast and predicting course of typhoon. Moreover, by combining with AMSR aboard Midori-II (ADEOS-II), more frequent observation with shorter time intervals will be possible.
|
|