Advanced Land Observing Satellite "Daichi":
Switching to the Redundant Data Relay Satellite Communication Equipment and
Emergency Observations of the Solomon Islands Following Earthquake
Switching to the Redundant Data Relay Satellite Communication Equipment and
Emergency Observations of the Solomon Islands Following Earthquake
Japan Aerospace Exploration Agency (JAXA)
At around 2:26 p.m. on April 5, 2007 (Japan Standard Time, JST, (all date and times hereinafter are in JST,) the observation data relay from the Advanced Land Observing Satellite "Daichi" to the Data Relay Satellite "Kodama" was interrupted. The "Daichi" was launched in January 2006 by the Japan Aerospace Exploration Agency (JAXA.)
JAXA investigated the situation based on already acquired telemetry data, and at around 5:00 p.m. on April 8 the transmission system of the Daichi onboard data relay satellite communication equipment was switched to the redundant system to restore normal operations. We are continuing to study the cause of this phenomenon.
Observation data acquisition during the data transmission interruption was continuously performed by direct transmission between the Daichi and ground stations without relays. During that direct transmission period, at around 8:38 a.m. on April 8, JAXA conducted an emergency observation of the Solomon Islands Region. As a result of the data analysis, we were able to acquire image data of the areas stricken by the Solomon Island Earthquake. (Please refer to the attachment.)
Japan Aerospace Exploration Agency (Tsukuba Space Center)
ALOS Project Team, Office of Space Applications
Yuji Osawa, Project Manager
Tel: 029-868-4078 (+81-29-868-4078 from overseas)
|
|
Emergency Observation on the Solomon Islands Earthquake
At around 5:39 a.m. on April 2 (Japan Standard Time, JST, or at around 7:39 a.m. local time,) an 8.1 magnitude earthquake hit the Solomon Islands. The Japan Aerospace Exploration Agency (JAXA) performed emergency observations using the Advanced Land Observing Satellite "Daichi," and, as a result of the data analysis, we were able to acquire image data of disaster-stricken areas by the onboard observation equipment, AVNIR-2*1 and PALSAR*2. (Please see the following images.)
Figure 1 is an image taken by the AVNIR-2 at around 8:38 a.m. on April 8. It is a false color image*3 allocating the band 4, 3, and 2 to red, green and blue respectively. In this image, trees are in red, and bodies of water are darkened. Figure 2 is an enlarged image of the southern region of Gizo Island, which was closer to the epicenter. Figure 3 is an image of the same area taken on March 8, 2007 showing the landscape before being hit by the earthquake. By comparing them, we were able to clarify the areas where forests and trees seemed to be destroyed by tsunami waves.
Figure 4 is an image taken at around 8:38 a.m. on April 8 by the PALSAR covering a broader area. It observed the stricken area at an angle of 36.9 degrees from the descending orbit. As a result of comparing images before and after the earthquake, we were able to observe geographical changes, the expansion of the land area, in the cut-out area (Area A), which seemed to be caused by a plate collision.
*1 AVNIR-2 can acquire color images with its resolution of 10 meters on the ground when Daichi is above that spot.
*2 PALSAR is a microwave sensor receiving radio wave reflections transmitted from the satellite. It can acquire image data regardless of the weather and time of a day.
*3 False color images are synthetic color images by allocating bands of colors that are different from actual colors visible by the human eye. In this case, the high sensitive near infrared band (Band 4) was allocated with red to show plants and trees in order to clearly show their change.
Japan Aerospace Exploration Agency (Tsukuba Space Center)
General Services Division,
Program Management and Integration Department,
Office of Space Applications
Ms. Sasaki / Ms. Okuda
Tel: 029-868-5277 or 5288
(+81-29-868-5277 or 5288 from overseas)
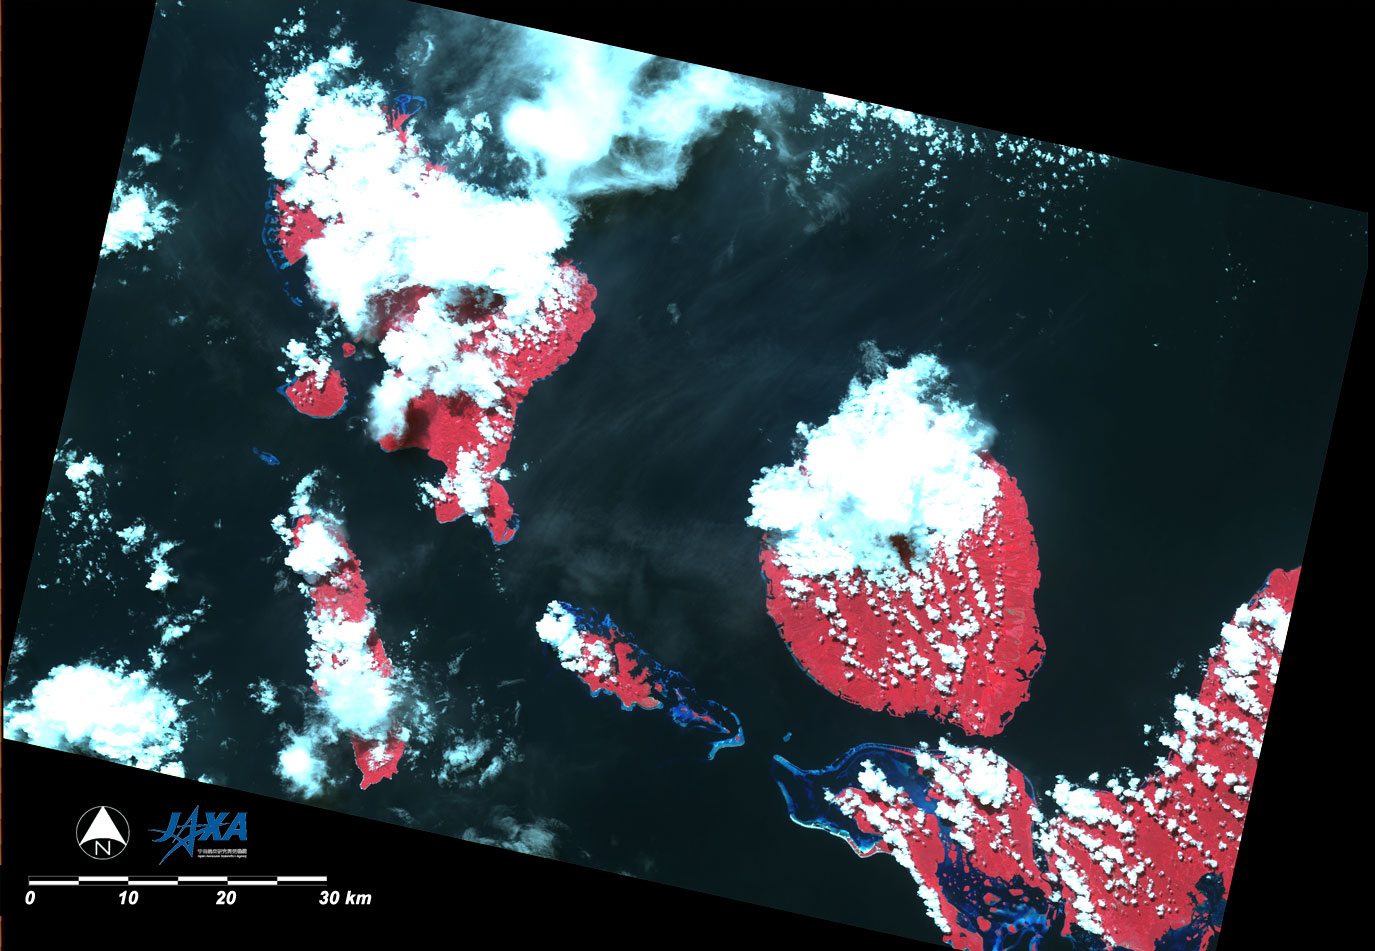
AVNIR-2 False Color Image taken on April 8, 2007
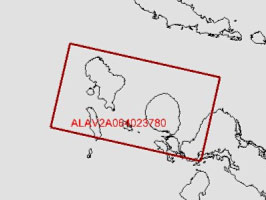
(The map below shows the location of the above satellite image.)
[Figure 2: After the Earthquake]
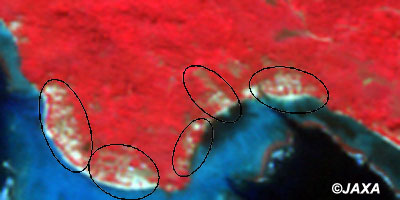
The enlarged image of the southern area of Gizo Island taken by the AVNIR-2 on April 8, 2007.
Compared to Figure 3 below, which shows the area before the earthquake,
trees and forests shown in red obviously decreased in the black circled areas.
It appears to have been caused by tsunami waves.
[Figure 3: Before the Earthquake]
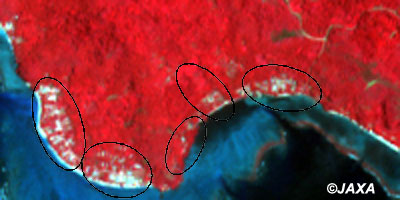
Enlarged Image taken by AVNIR-2 on March 8, 2007
* Due to the difference in the bonding angle,
there are slight difference in image definition in the above two photos.
(-37 degrees after the earthquake, and 0 degrees before.)
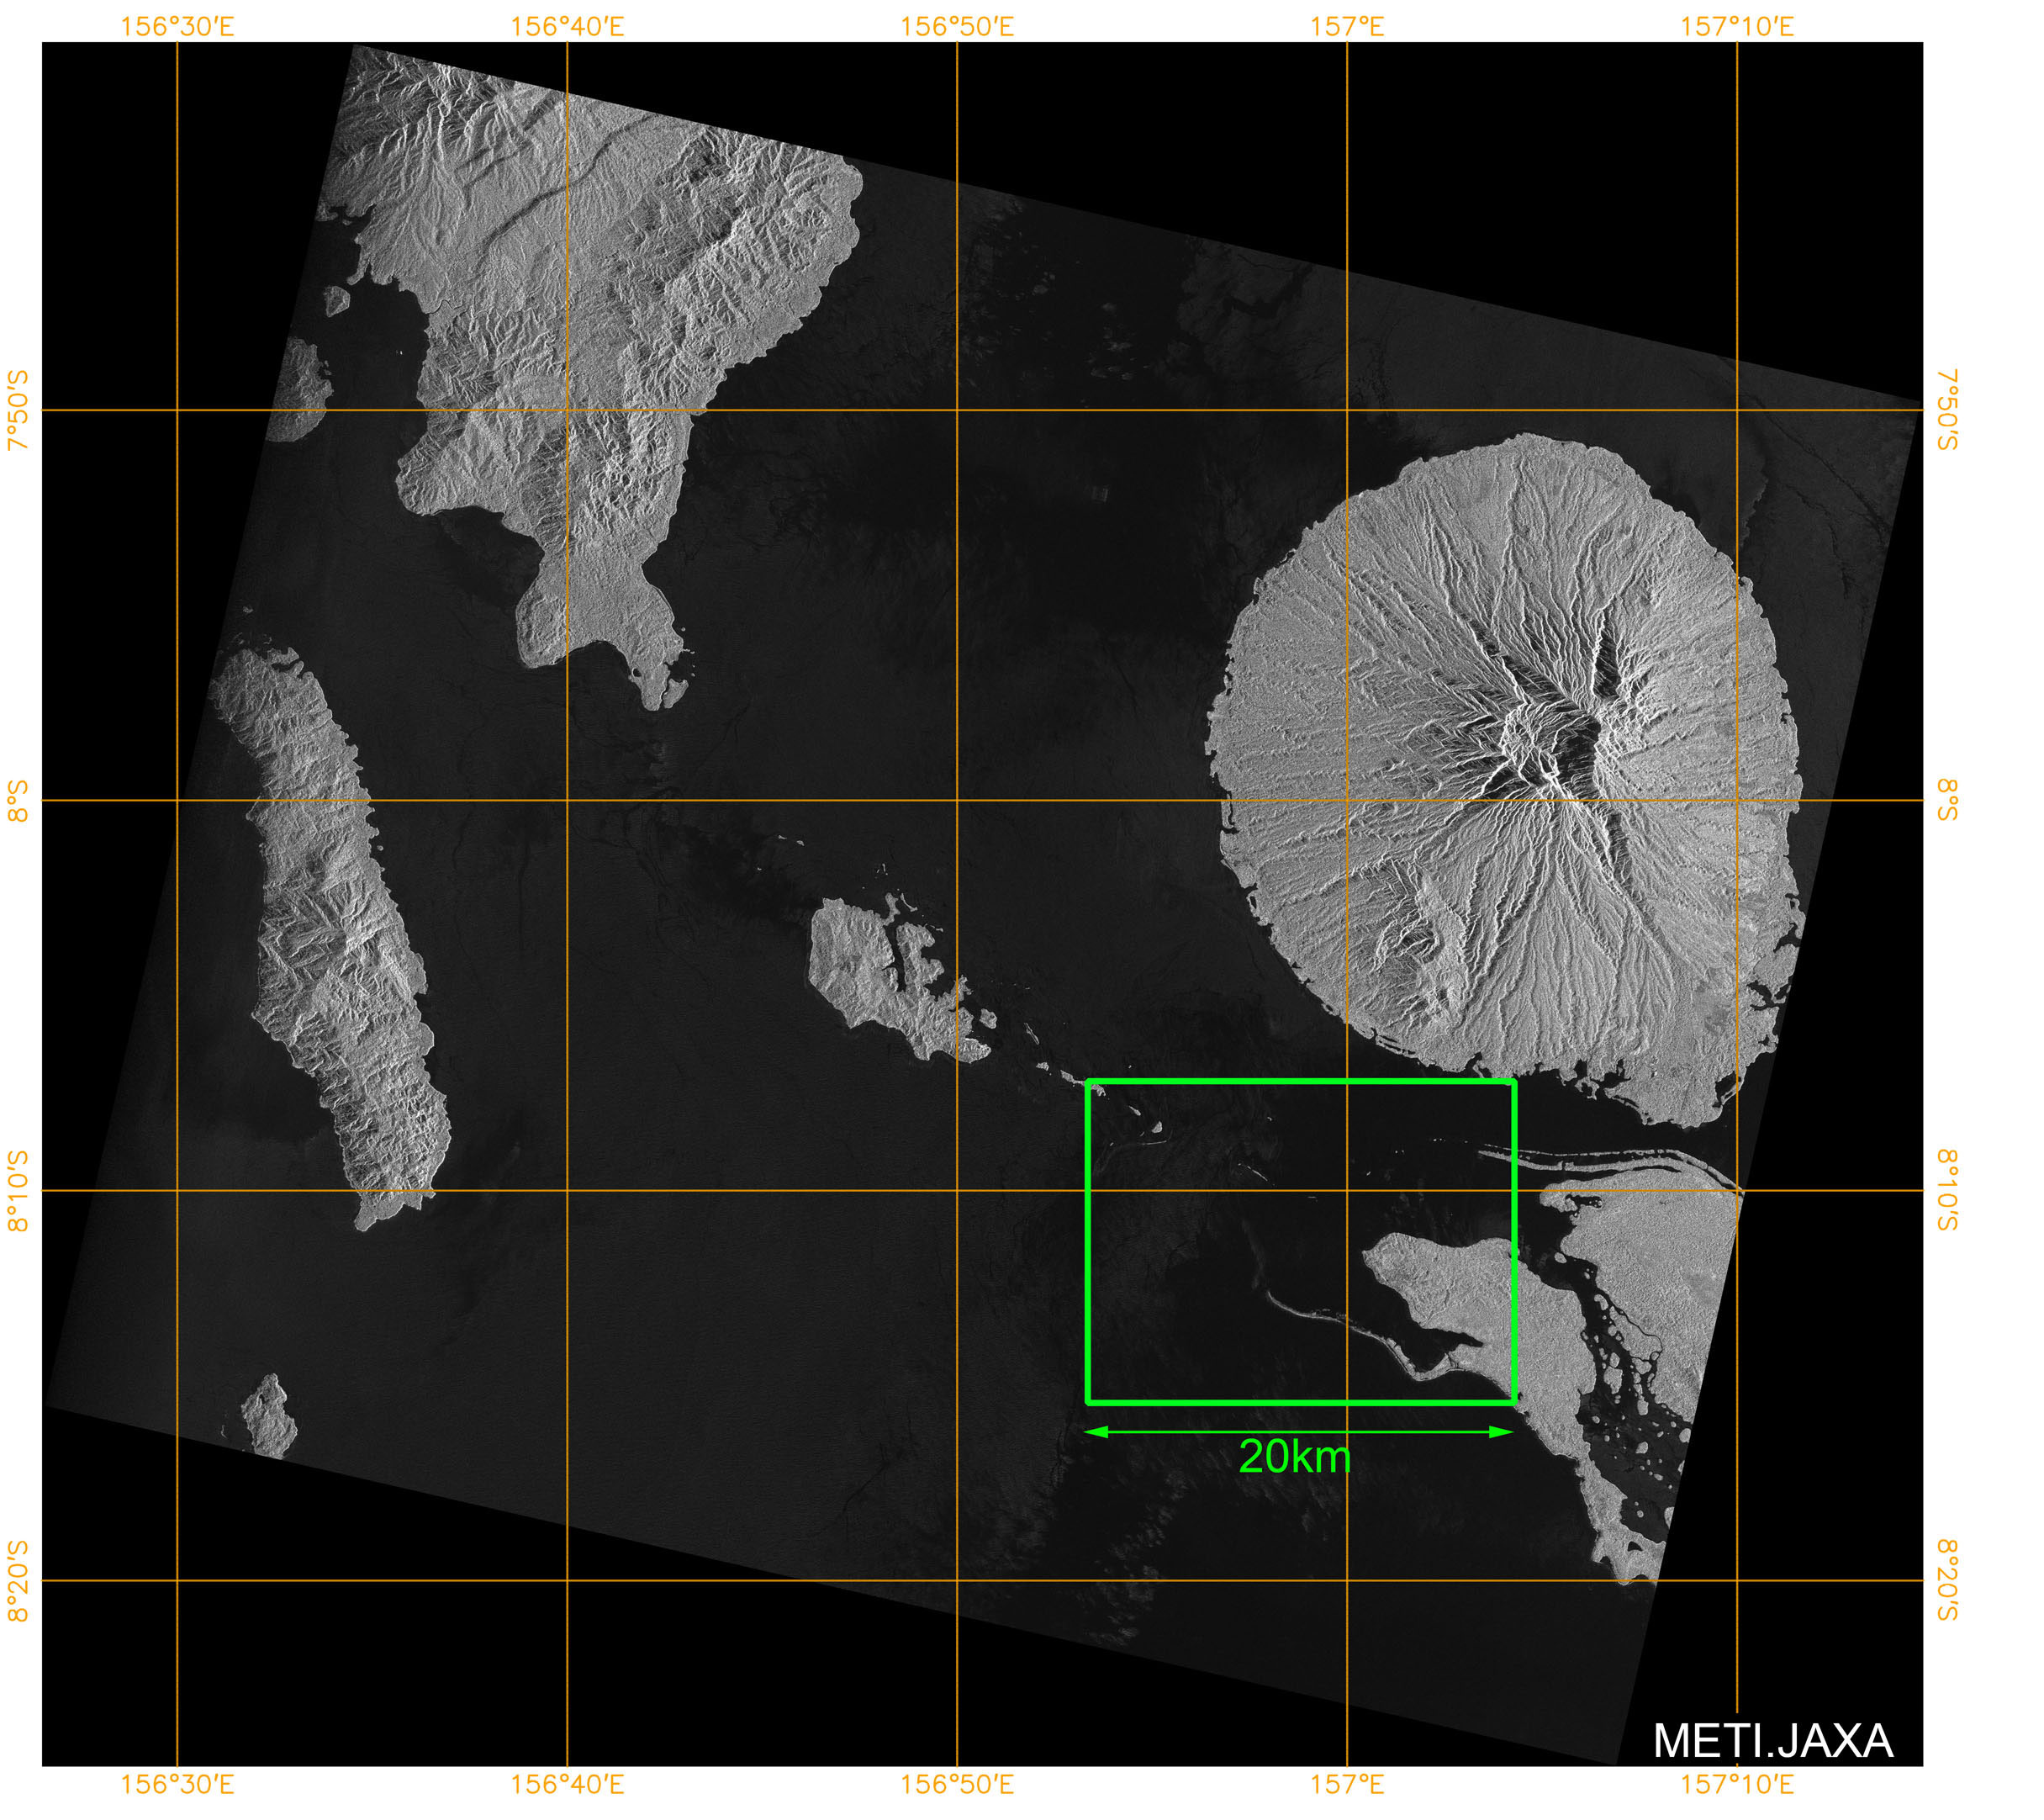
The above image of the disaster stricken area was taken on April 8, 2007 from 36.9 degrees on a descending orbit.
The image covers within a radius of 70 kilometers.
[Figure 5: After the Earthquake]
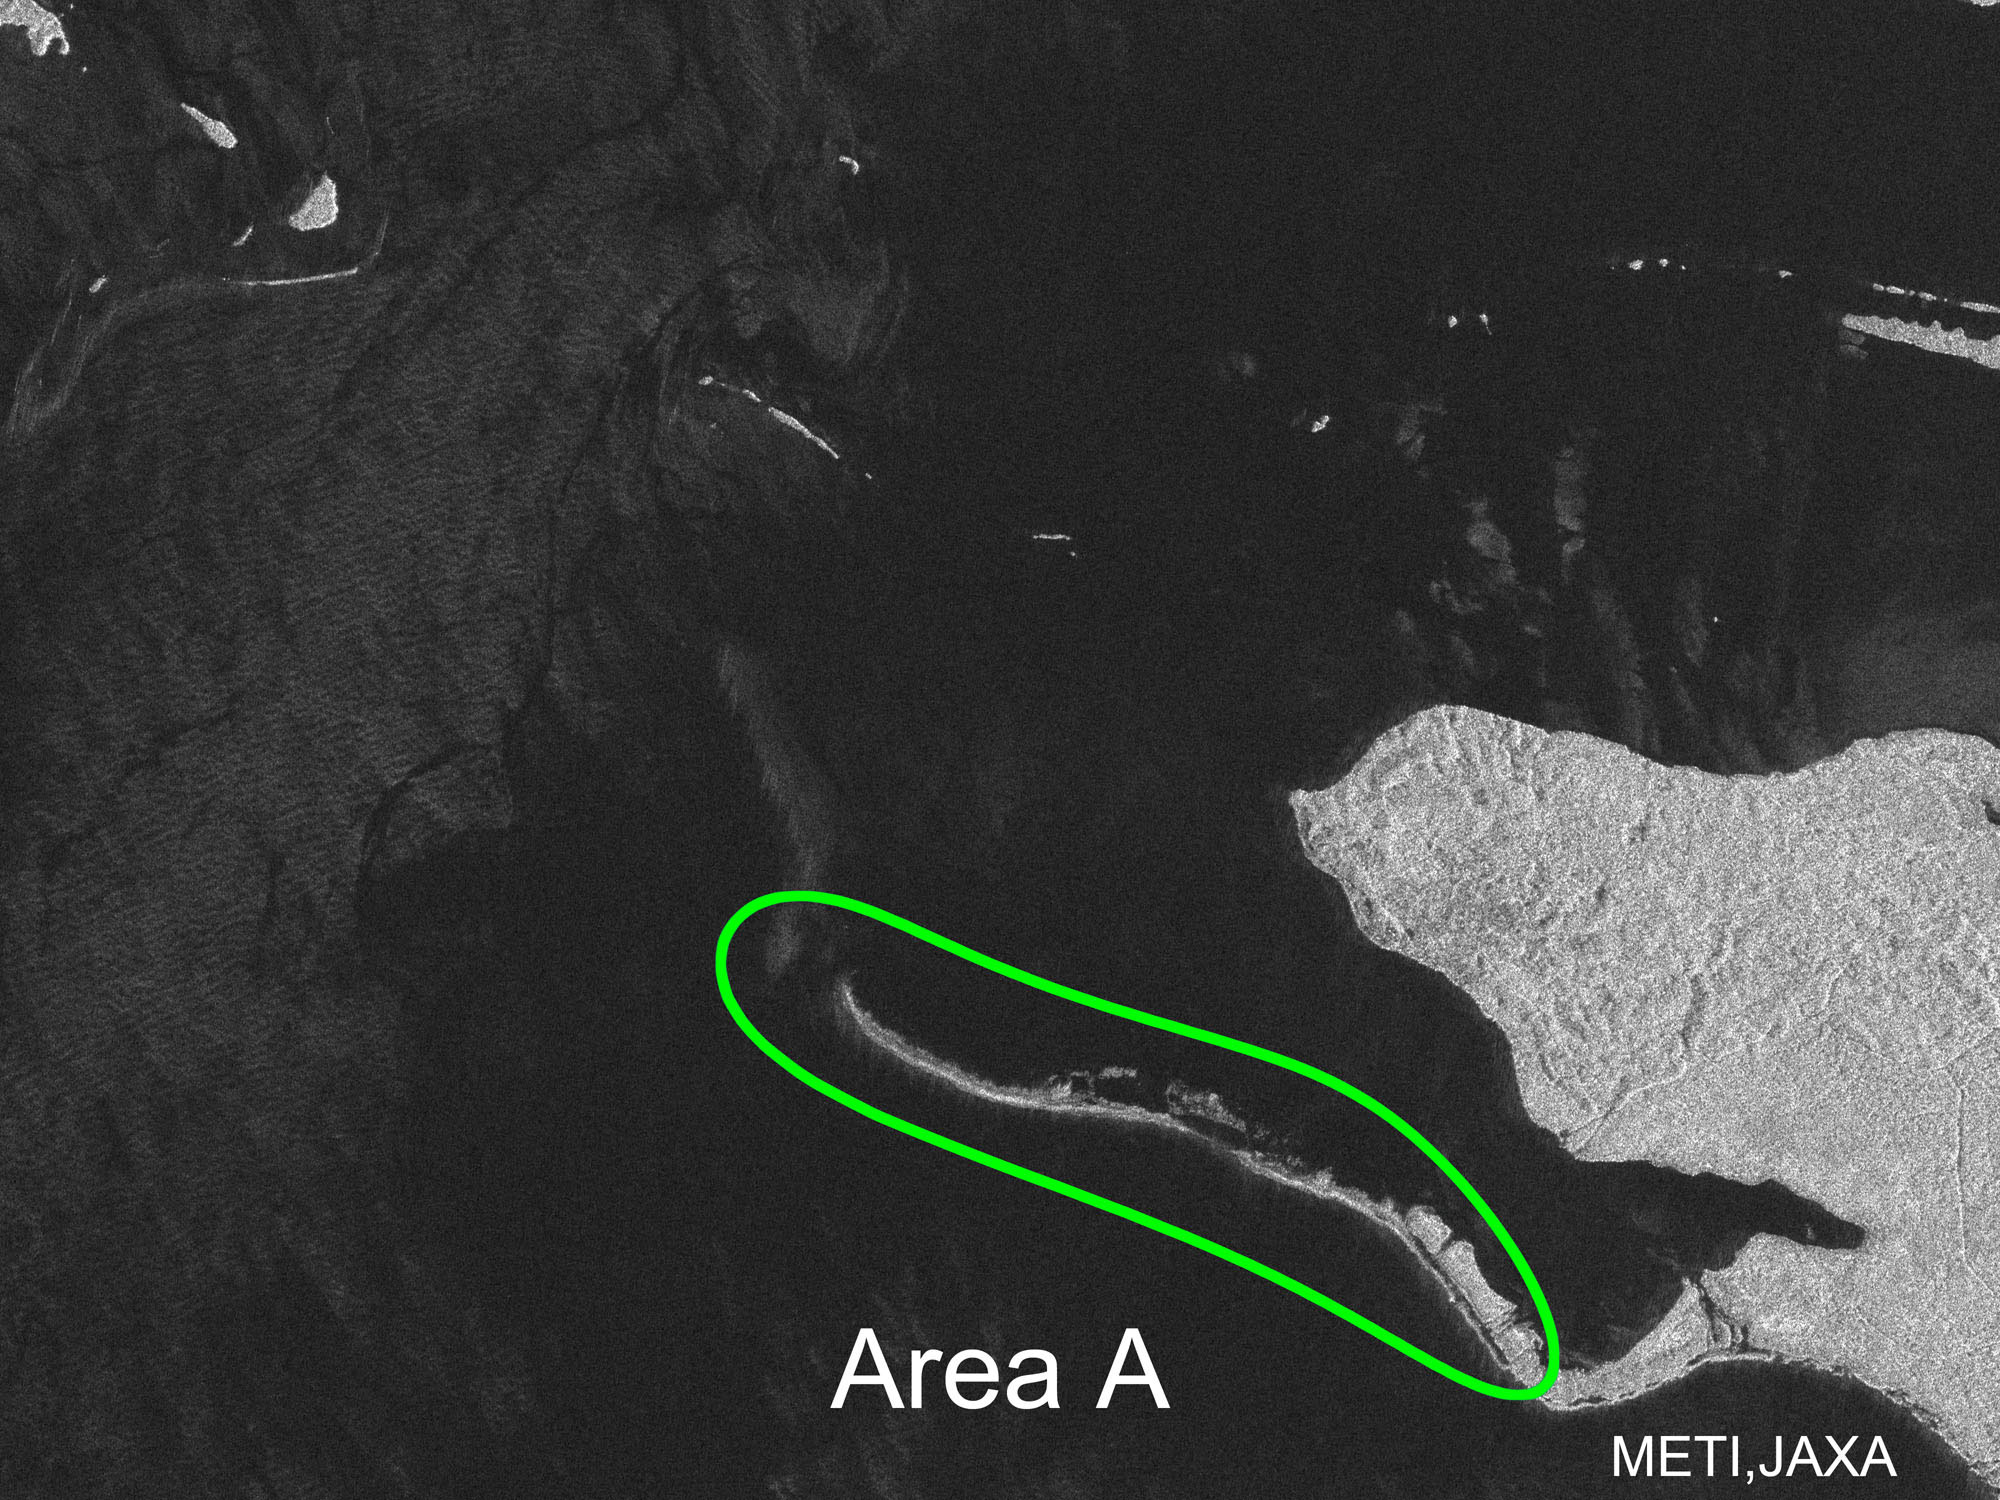
This image taken by the PALSAR (on April 8, 2007) shows the area encircled by a square in Figure 4 Compared to Figure 6 below,
which shows the Area A at the time of low-tide level, the land obviously extended (circled by a green line.)
[Figure 6: Before the Earthquake]

The same area as Figure 5 taken by the PALSAR (on January 31, 2007.)
It was taken when the tide level was at its lowest.
For inquiries:
JAXA Public Affairs Department
Tel: +81-3-6266-6413 to 7, Fax: +81-3-6266-6910