Total area of sea ice in Arctic Ocean smallest
since observations started
- Much faster pace of ice melting than forecasted -
Japan Agency for Marine-Earth Science and Technology (JAMSTEC)
Japan Aerospace Exploration Agency (JAXA)
Overview
The Japan Agency for Marine-Earth Science and Technology (JAMSTEC, led by President Yasuhiro Kato) and the Japan Aerospace Exploration Agency (JAXA, led by President Keiji Tachikawa) cooperatively analyzed oceanic and atmospheric observation data and sea ice data acquired by satellites, and found that the sea ice area in the Arctic Ocean has been decreasing at a much faster pace than expected compared to the previous worst record in the summer of 2005. After satellite observations started in 1978, the observed area shrunk to its lowest level on August 15, 2007. Ice melting normally continues until mid September, thus further shrinkage of the sea ice area is expected. The observed phenomenon significantly exceeded the forecasted model submitted in the Intergovernmental Panel on Climate Change (IPCC) fourth Assessment Report, and the big difference tells us that the model may not precisely reflect the actual situation in the Arctic Ocean.
Contents
The following are findings as a result of analyses of observation data acquired by the Advanced Microwave Scanning Radiometer (AMSR-E)*1. The AMSR-E acquires observation data and visible images of sea ice density.
- Since July, the smallest record of sea ice area in the Arctic Ocean has been broken every day.
- Since the beginning of August, the shrinkage of sea ice has been accelerated by a low pressure system generated and lingering off Siberia.
- On August 15, the total sea ice area in the Arctic Ocean reached a new low.
- If this pace of melting continues, the sea ice area reduction pace may significantly exceed the IPCC forecast, and it may actually reach the forecasted values for 2040 to 2050 (Figure 2 and 3.)
The following are estimated causes of accelerated sea ice reduction this year as a result of the comprehensive analysis of the observation data acquired by JAMSTEC including observation data by ships, continued observation by drifting buoys (JCAD, POPS*2) and atmospherics data. (Please refer to Figure 4)
- Sea ice reduction has been observed not only along the coast of Alaska but also along the Arctic Ocean shore of Canada this year. Accordingly, the impact of friction from coastal areas is smaller than usual thus sea ice tends to move in a large scale. Therefore, fragile and easy-to-melt ice that has just formed in coastal areas moves over a north latitude of 80 degrees and spreads into the Arctic Ocean.
- As the fragile ice spreading into the Arctic Ocean melted quickly and that facilitates the ocean water to absorb more sunshine, ocean warming and sea ice melting have accelerated.
- More sea ice has been drifting toward the Atlantic Ocean from the Arctic Ocean, thus the volume of sea ice in the Arctic Ocean has been decreasing.
(URL:http://www.ijis.iarc.uaf.edu/cgi-bin/seaice-monitor.cgi?lang=e)
*1
AMSR-E:
The Advanced Microwave Scanning Radiometer (AMSR-E) is one of the onboard sensors of the American earth observation satellite Aqua, which was launched in May 2002. By observing weak radio frequencies emitted from Earth, the AMSR-E can measure sea ice, ocean temperature, water vapor, and precipitation, day and night regardless of weather conditions. The successor of the AMSR-E, the AMSR2 (which will be installed into the GCOM-W1 satellite) is under development and is scheduled for launch in Japan Fiscal Year 2011.
*2
J-CAD (JAMSTEC Compact Arctic Drifter):
The JAMSTEC Compact Arctic Drifter (J-CAD) is a buoy that can automatically observe ocean temperature, salt content, and ocean current up to 250 meters in depth, as well as surface temperature and atmospheric pressure in sea ice in the Arctic Ocean. By placing it on drifting sea ice in the Arctic Ocean, the J-CAD can observe broader areas. Developed by JAMSTEC, it was used between 2000 and 2005. Since 2006, the new generation buoy, POPS, has been in operation.
POPS (Polar Ocean Profiling System):
The Polar Ocean Profiling System is an observation system that enabled multi-year observations of sea ice in the Arctic Ocean using an argofloat. A platform is attached to sea ice, and an argofloat is suspended with a cable from the platform. The argofloat bobs up and down along the cable to measure water temperature and salt content between 10 and 1,000 meters deep in the ocean.
Related Links
Arctic Ocean Climate System Group Website, Institute of Observational Research for Global Change, JAMSTEC
http://www.jamstec.go.jp/arctic/
AMSR-E Site, Earth Observation and Research Center, JAXA
http://sharaku.eorc.jaxa.jp/AMSR/index_e.htm
|
|
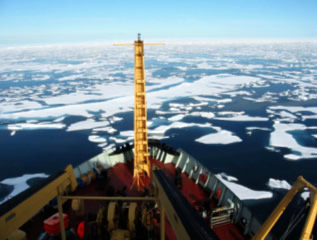
Figure 1: The status of ice in the Arctic Ocean as observed
from the ship "Louis S. St-laurent" on August 6, 2007.
(Photo taken by Ph. D. Motoyo Ito,
Research Scientist of Arctic Ocean Climate System Group, JAMSTEC)
 |
 |
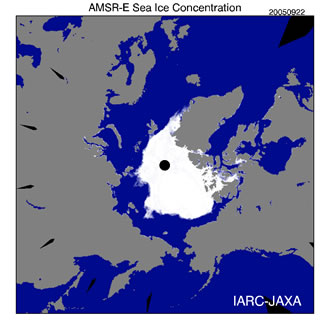
| September 22, 2005 (Previous worst record in history) |
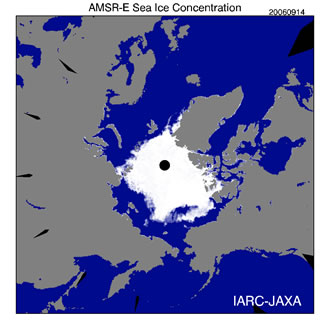
September 14, 2006 |
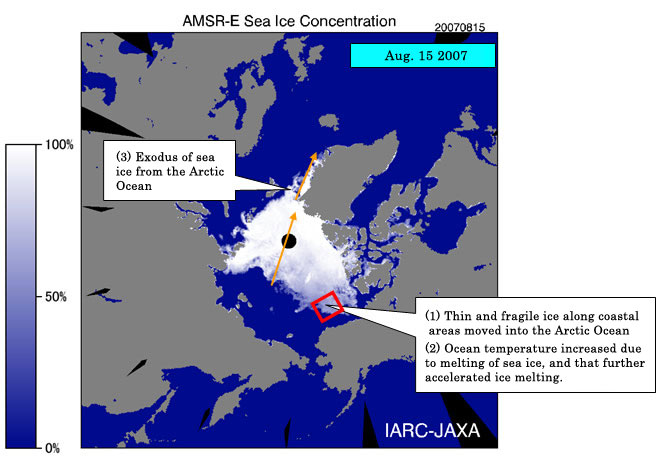
Figure 2: Data observed by AMSR-E.
The status of sea ice in the Arctic Ocean at its lowest level
in 2005 and 2006 (above) and that on August 15, 2007, (below).
The area encircled by a red frame shows the sea ice melting area. Please also see Figure 4.
On August 15, 2007, the area got smaller than the worst record marked in September 2005.
The receding of sea ice is especially noticeable toward the North Pole in North American Coastal areas and the Northern ocean area of East Siberia.
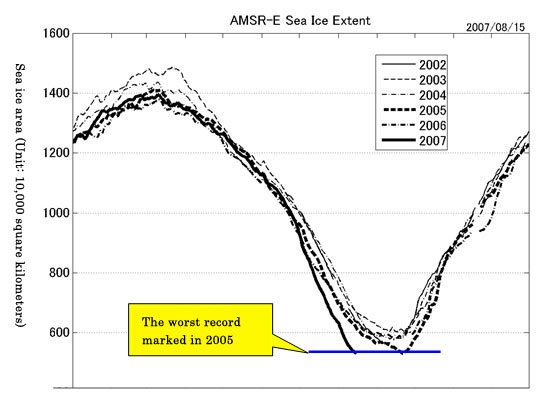
Figure 3: Change in the sea ice area in the Arctic Ocean as acquired by the AMSR-E (2002-2007)
A graph shows the change in the sea ice area in the Arctic Ocean between 2002 and 2007. Until this June, the area change trend was about the same as previous years, but since July, each day sets a new low record. On August 15, the previous worst record marked in Sep. 2005 was broken more than one month earlier. The shrinking area is expected to continue, and new records are expected.
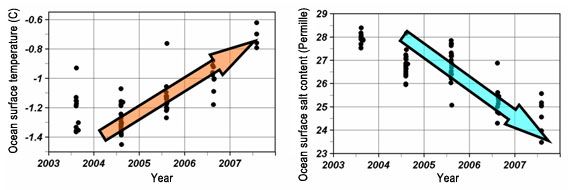
Figure 4: Change of ocean surface temperature
and salt content over years in sea ice melting areas
(Coastal areas of Alaska: North latitude 73.5-76 degrees and
West longitude 145-155 degrees [Red framed area in Figure 2])
The ocean surface temperature is increasing, and this year the temperature is the highest since 2000. Accordingly, sea ice melting is worsening and significant reduction of salt content in the ocean surface has been observed*.
*Sea ice contains little salt, thus, when it is melted, the salt content in the ocean is decreased.