KAGUYA (SELENE)
Observations using the Spectral Profiler (SP)
December 14, 2007 (JST)
Japan Aerospace Exploration Agency (JAXA)
The Japan Aerospace Exploration Agency (JAXA) verified the Spectral Profiler (SP) onboard the lunar explorer "KAGUYA" (SELENE) orbiting approximately 100 km above the lunar surface, through initial observations on November 3, 2007, and subsequent data analysis. The obtained data is the world's first continuous reflectance spectra of the far side of the Moon in the visible and near infrared region.
The satellite was confirmed to be in good health through telemetry data received at the Usuda Deep Space Center.
Spectral Profiler (SP)
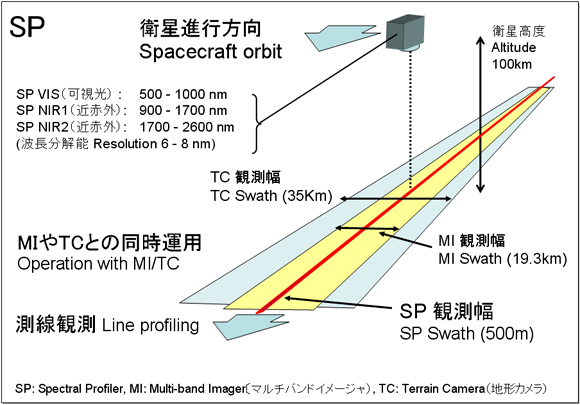
The Spectral Profiler (SP) is a spectrometer that can obtain continuous reflectance spectra of the lunar surface from the nadir direction of the main orbiter "KAGUYA" in a broad spectral coverage (500-2600 nm) at a high spectral resolution (6-8 nm) and high spatial resolution (500 m) [Figure 1]. It will conduct, for the first time in the world, continuous global spectral observations of the Moon in the visible to near infrared region. The initial functional check of the SP on November 3, 2007, successfully produced a series of spectra along a strip longer than 1,000 km on the far side of the Moon [Figures 2-4].Continuous visible and near infrared reflectance spectra are to be used to precisely determine the type and breakdown of minerals on the lunar surface. Ground-based spectroscopic observations of the lunar surface are limited in area coverage to the near side of the Moon and are also in spectral and spatial resolutions due in part to the effects of the Earth's atmosphere. Observations with historical orbiters have so far been limited in spectral coverage, restricting detailed information on the lunar surface mineral composition. With unprecedented accuracy, the Spectral Profiler performs global spectroscopic mapping of the Moon with its broad spectral coverage, and high spectral and spatial resolution, which is necessary for the determination of the type and breakdown of lunar surface minerals.
In addition, one can obtain comprehensive information on the lunar surface material by combining data from the Spectral Profiler with that taken with the Multi-band Imager (MI), which measures detailed spatial distribution of minerals, as well as that from the X-ray Spectrometer (XRS) and Gamma-ray Spectrometer (GRS), which measure spatial distribution of elements. This has led to a breakthrough in research on the formation and evolution of the Moon.

Fig. 1 SP Observation Specification
*To determine the precise SP observation area, SP observation operations always follow the observation operation of MI or TC
*To determine the precise SP observation area, SP observation operations always follow the observation operation of MI or TC

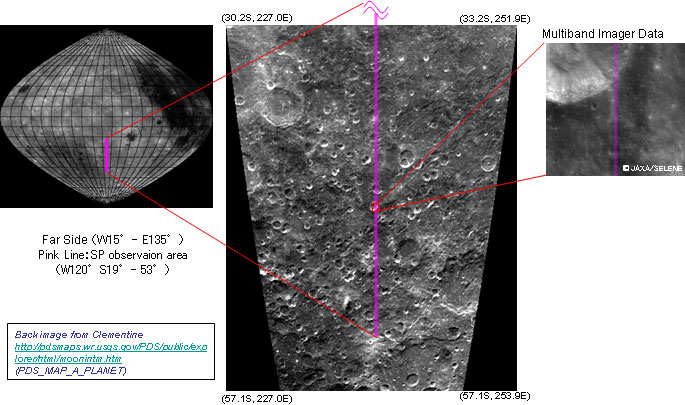
Fig. 2 First light observation location of SP
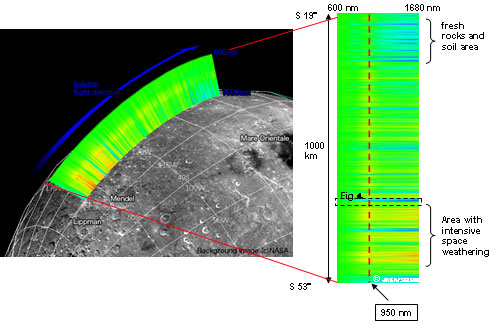
The two figures on the left are visualized images produced from SP data normalized at 600 nm with a simple correction to the variation of the overall reflectance of the lunar surface and SP detectors response.
The horizontal X axis of the right figure shows wavelength (600nm-1680nm) and vertical Y axis shows longitude (S19-53 degree - 1000km).
The red part shows relative strong reflectance, while yellow, green and blue show weaker reflectance than the red area, respectively. The color change from green to yellow at around 950nm is expected to correspond with iron-bearing mineral distribution.

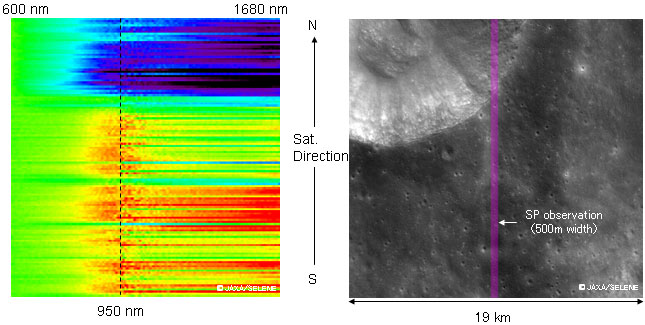
SP data near the crater shown in Fig. 2 Same crater image simultaneously observed by MI
Fig. 4 SP and MI data near a crater shown in Fig. 2
The pink part on the right figure of the MI data shows the line profiling with SP observation area. SP data is expected to show that fresh rock and soil exist in a small crater or on the slope of a large crater since the color of the profile is longer than 600nm and has changed from yellow-green to blue or black (reflectance of the location is weak in longer wavelengths). However, the other area is experiencing space weathering since the color changed from yellow-green to yellow or red (reflectance of the location is strong).
The pink part on the right figure of the MI data shows the line profiling with SP observation area. SP data is expected to show that fresh rock and soil exist in a small crater or on the slope of a large crater since the color of the profile is longer than 600nm and has changed from yellow-green to blue or black (reflectance of the location is weak in longer wavelengths). However, the other area is experiencing space weathering since the color changed from yellow-green to yellow or red (reflectance of the location is strong).
|
|
