KAGUYA (SELENE) Observations with Laser Altimeter (LALT)
and Lunar Radar Sounder (LRS) Sounder Mode
Japan Aerospace Exploration Agency (JAXA)
The Japan Aerospace Exploration Agency (JAXA) carried out observations using two onboard sensors of the lunar explorer KAGUYA -- the Laser Altimeter (LALT) and sounder mode (*) of the Lunar Radar Sounder (LRS).
Through analysis of the LALT data taken from November 26 (Japan Standard Time, all the following dates and times are JST), 2007, we confirmed that the lunar topography can be deduced as planned. The LALT is expected to obtain a global and precise topographic data set of the Moon, including the polar regions with a latitude higher than 75 degrees that have never been explored by previous satellites. This data set, in combination with the high-spatial-resolution stereoscopic observation data to be taken with the Terrain Camera (TC), will compose the first complete, precise, and high-spatial-resolution topographic map of the Moon.
The LRS sounder mode was tested on November 20 and 21, 2007, over the eastern Mare Imbrium, and the performance of this mode was verified. The data obtained in this experiment visualized largely horizontal subsurface stratification, which probably consists of alternating beds of lava, volcanic ashe and ejecta blankets. The existence of such a strata has been expected for decades based chiefly on surface geology. By means of global scanning, the LRS will provide us with a massive amount of information on the subsurface geology of the Moon down to a few kilometers from the surface. Faults and folds, identified from the discontinuity or disturbance of subsurface stratification, are important clues to understand not only regional tectonics but also the evolution of the Moon, including global thermal history.
* The LRS has two observation modes - a sounder mode for subsurface sounding and a natural radio observation mode for observations of natural plasma waves and natural radio waves.
Laser Altimeter (LALT)
The Laser Altimeter (LALT) is a ranging instrument that emits a laser beam to the lunar surface and measures the distance to it from the main orbiter by the timing delay of the reflected light. As it uses laser reflection, it can measure the topography of the shadowed areas such as the inner regions of the polar craters.The main scientific outcomes of LALT will include the following:
- Completion of the first global and precise topographic data set of the Moon, including the polar regions with a latitude higher than 75 degrees that have never been explored by previous satellites (*) . This data set, in combination with the stereoscopic observation data taken with the Terrain Camera (TC), will compose the first complete, precise, and high-spatial-resolution topographic map of the Moon.
- Synergy with other scientific missions. For instance, the lunar topography will be analyzed in combination with the gravity field deduced from the RSAT/VRAD data for the retrieval of the lunar inner structure such as the thickness distribution of the lunar crust.
Among data taken since November 26, 2007, Figure 1 shows the topography of the Mare Orientale deduced from the observation data taken on December 12 and 25, 2007. This demonstrates that the LALT can obtain high-accuracy topographic data.
* Previous data taken with the laser altimeter (LIDAR) onboard the Clementine satellite had a height resolution of about 100 m with a mean sampling interval of about 20 km along orbits separated by about 60 km, and did not cover polar regions. The LALT will cover the entire region of the Moon with a height resolution of 5 m at a sampling interval smaller than 2 km.
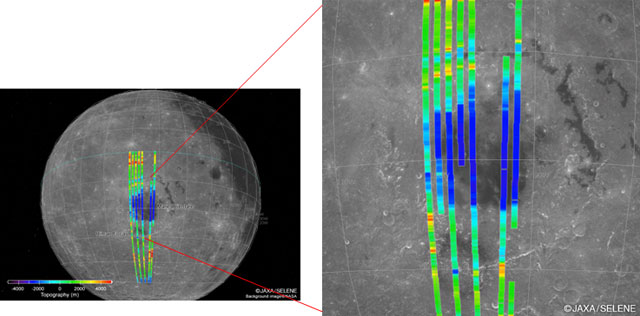
The topography of the Mare Orientale (19.4S, 92.8W) deduced from LALT data.
The topography refers to a 1737.4 km sphere centered at the center of the mass of the Moon. The right-hand side of the map corresponds to the near side of the Moon. Regions coded in blue have a lower altitude, and those in red are higher. The data is still preliminary and needs further calibration to be compared with background NASA data using the NASA World Wind system. The observation period (JST) of the data used to make this plot is December 12 07:32:22 - 15:04:06 and December 25 14:00:11 - 18:20:32.
Lunar Radar Sounder (LRS) - Sounder Mode
The Lunar Radar Sounder (LRS) will measure the lunar subsurface structures down to a few kilometers in depth with the HF (5 MHz) radar instrument utilizing digital technology. The existence of a widely-distributed strata has been suggested from the observations of the lunar surface since the Apollo era. The LRS will enable more robust detection of the subsurface structures throughout the Moon compared to the previous radar sounder measurements of the Moon -- the ALSE (Apollo Lunar Sounder Experiment) of the Apollo 17 mission that measured selected areas of the lunar mare regions on the near side of the Moon and demonstrated the feasibility of the radar sounding of the subsurface structures at a depth down to 2 kilometers. We expect to detect many faults and folds that measure a few kilometers deep, which will tell us about the lunar evolution such as a cooling history of the Moon since its surface was hotter and less rigid than now.Initial results on the lunar subsurface structure were obtained using the LRS sounder mode observation data collected on November 20 and 21, 2007. The received radar echo (Figure 3) was as expected through computer simulation (Figure 2). The extraction of radar echoes reflected by subsurface structures was demonstrated to be satisfactory.
In addition to the conventional sounding technique that tests echo trace in the plots like Figures 2 and 3, a new method that uses not only the amplitudes of the echoes but also their phases was proved feasible. This method utilizes the synthetic aperture radar (SAR) technique with foci of variable depths and ensures robust detection of radar echoes from subsurface structures (Figure 4).
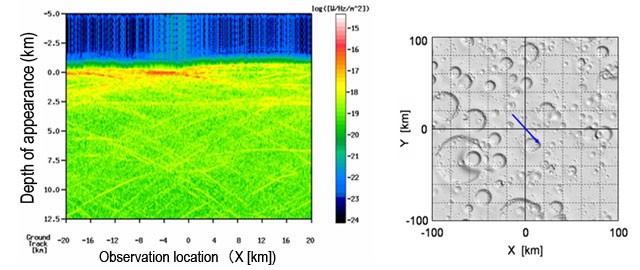
Simulated radar echoes to be observed by the KAGUYA (left) as it travels over the model surface structure (right) (Kobayashi et al. 2002). In the diagram, vertical and horizontal axes correspond to the apparent depth and positional offset, respectively, and coded in color is the amplitude of radar echo. The apparent depth is the delay timing divided by the speed of light. In the 2-D diagram, echoes from large craters appear as hyperbolic coherent features, while surface clatters from numerous small craters appear as random noise near the surface. The targeted radar echoes from subsurface structures appear as continuous features with nearly constant depths. Subsurface echoes can be detected in this manner.
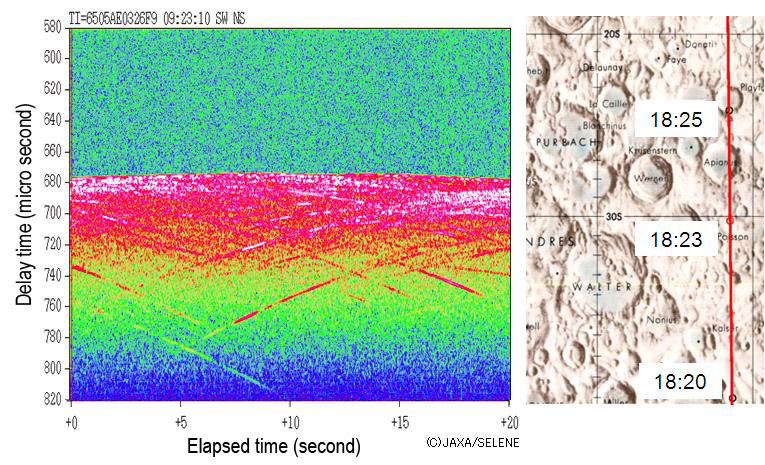
These agree with the simulated echoes in Figure 2 in the following aspects:
- Trace and amplitude variation of the surface crater echoes in the 2-D diagram.
- Behavior of the surface clatters (unwanted radar echoes caused by adjacent craters that interfere with the detection of subsurface echoes, particularly in highland regions).
These ensure validity of the new data analysis method established with the computer simulation results. Here both crater echoes and surface clatters are classified as interference due to surface reflection, and we refer to the coherent echoes as "crater echoes" and the incoherent ones as "surface clatters".
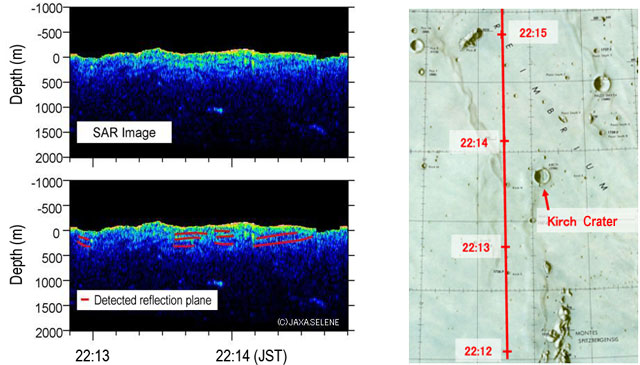
Shown in the upper left panel are results of the SAR detection of reflective subsurface structures down to 500 m by focusing on relatively shallow regions. The depth refers to the 1737.4 km sphere centered at the center of the mass of the Moon. Red lines in the lower left panel show evident reflecting interfaces in the section, which is 180 km long. True dips of the interfaces are very small, as those sections are vertically exaggerated by a factor of ~30. This means that the mare is underlain by horizontally lying strata as thick as 500 m, probably composed of lava, volcanic ashe and ejecta blankets. This experiment verified the performance of the LRS sounder mode observation, and at the same time provided direct evidence for the existence of depositional units underneath the Mare Imbrium.
* Lunar chart reference source: http://www.lpi.usra.edu/resources/mapcatalog
|
|