Initial Analysis of Observation Data
(Greenhouse Gas Concentrations)
from "IBUKI" Greenhouse gases Observing SATellite (GOSAT)
Japan Aerospace Exploration Agency (JAXA)
National Institute for Environment Studies (NIES)
Ministry of the Environment (MOE)
The "IBUKI", Greenhouse gases Observing SATellite (GOSAT), was launched from the Tanegashima Space Center on January 23, 2009. While data is currently in the preliminary stages of being calibrated and validated, an initial analysis of carbon dioxide and methane concentrations was recently obtained for clear-sky scenes over land.
In the future, after further calibration and validation of the data, observation data and corresponding analyzed products will be made available to registered users from the general public.
Details of this analysis can be viewed at the following websites.
http://www.gosat.nies.go.jp
[Contact regarding initial analysis]
Center for Global Environmental Research,
National Institute for Environmental Studies
16-2 Onogawa, Tsukuba, Ibaraki 305-8506 Japan
Phone : +81-29-850-2966 Fax : +81-29-850-2219
| (Attachment 1): | Carbon dioxide column averaged dry air mole fraction distribution (initial analysis) over land for April 20-28, 2009, obtained from TANSO-FTS shortwave infrared bands using clear-sky observations determined from IBUKI TANSO-CAI sensor data. |
| (Attachment 2): | Methane column averaged dry air mole fraction distribution (initial analysis) over land obtained as per method in Attachment 1. |
| (Attachment 3): | Sensors aboard "IBUKI", Greenhouse gases Observing SATellite (GOSAT) |
|
|
Reference: "IBUKI" Greenhouse gases Observing SATellite (GOSAT) Data Analysis Status
IBUKI is currently operating in an initial calibration and validation mode. The initial calibration of the mounted sensors, as well as tuning of the computer processing system, is underway at the Japan Aerospace Exploration Agency and the National Institute for Environmental Studies.
The attached diagrams show initial analyses of clear-sky carbon dioxide and methane column averaged dry air mole fraction (Note) over land for the period April 20-28, 2009. These carbon dioxide and methane data show a hemispheric gradient, with largest values in the Northern Hemisphere, broadly in agreement with existing ground-based measurements.
It should be acknowledged that the current analysis is based on uncalibrated data and consequently it is not appropriate to interpret estimated individual column averaged dry air mole fraction values. Future work will include a reanalysis of these data, accounting for the results of calibration and validation activities, and adjusting the data processing parameters.
(Note) Column averaged dry air mole fraction: The fraction of moles of a particular component of air divided by the total number of moles of gas in the same sample bound by a vertical column extending to the upper air, and not just on the ground surface.
Calculation of ground surface concentrations is a future research theme.)
In the future, after confirming the accuracy of calibration and processing activities for observation data (radiance spectra, etc.) and of validation activities based on comparison with ground-based observations, we plan to distribute calibrated observation spectrum data (TANSO-FTS data) and observation image data (TANSO-CAI data) (level 1 product) to registered users nine months after the satellite launch (late October 2009). We plan to distribute validated carbon dioxide and methane column abundances and cloud coverage flag data (level 2 product) 12 months after the satellite launch (late January 2010).
Furthermore, monthly distributions of greenhouse gas concentration will be available. In future work, level 2 products from IBUKI and concentration data measured at ground-based monitoring stations will be used together to estimate surface fluxes of carbon on a regional basis.
*GOSAT : Greenhouse gases Observing SATellite
Attachment 1:
Carbon dioxide (column averaged dry air mole fraction) initial analysis (April 20-28 observation data)
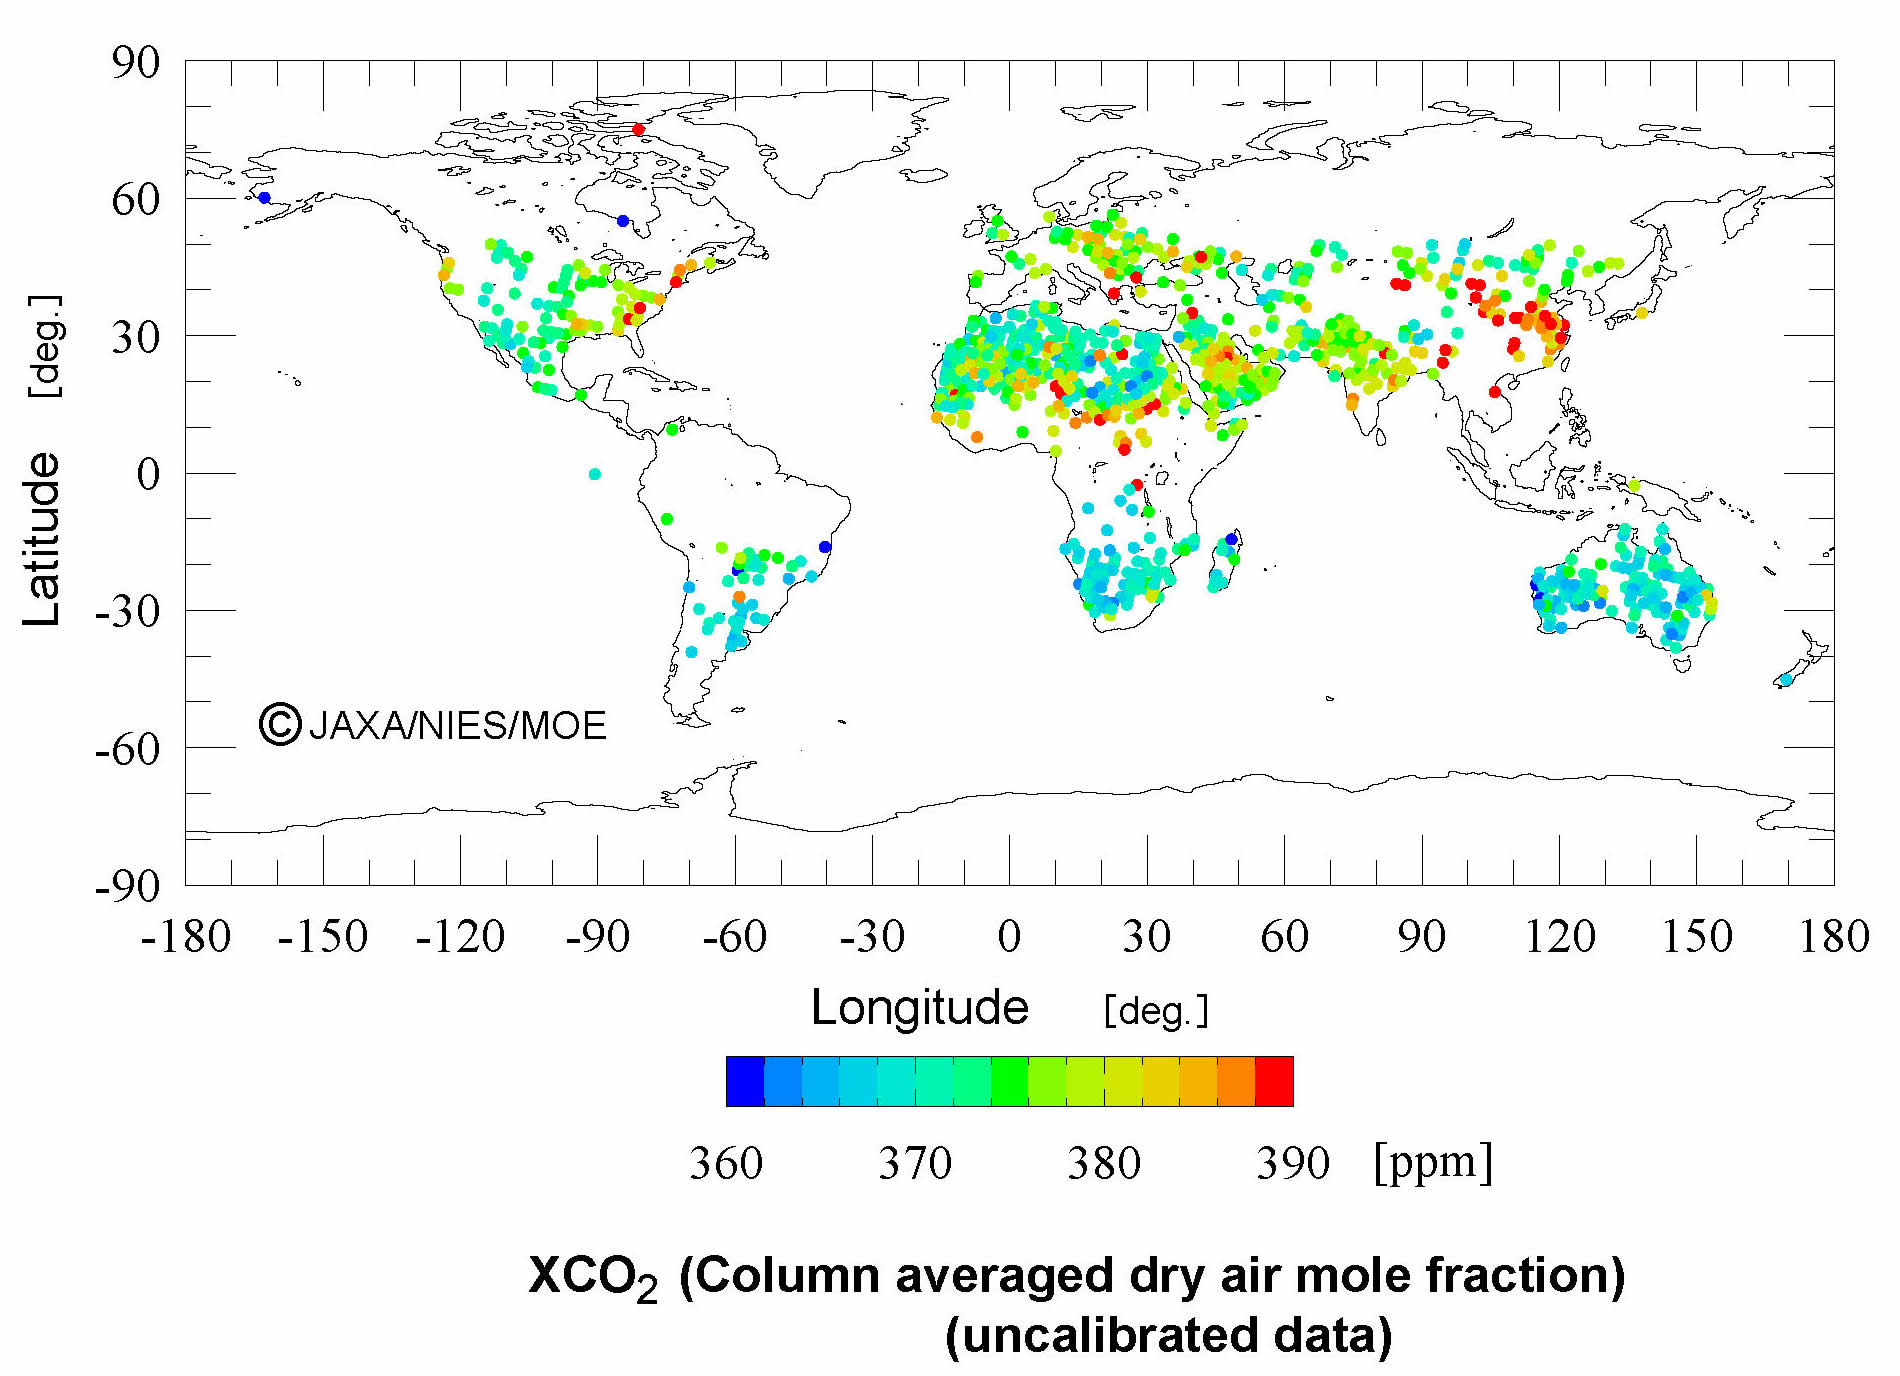
Figure: Carbon dioxide column averaged dry air mole fractions (XCO2) for clear-sky scenes analyzed using observations at shortwave infrared bands (radiance spectrum uncalibrated data) from the IBUKI greenhouse gas observation sensor (TANSO-FTS). Clear-sky scenes at individual TANSO-FTS observation points are determined using measurements from the cloud/aerosol sensor (TANSO-CAI). Data are excluded where the associated radiance spectra are saturated, and where noise is relatively large due to weak ground surface reflection.
In the initial analysis, the late April observation data shows a hemispheric gradient, with larger values over the Northern Hemisphere (Note 1), consistent with other measurements. Derived XCO2 values are generally lower than model predictions (Note 2). This is thought to be due to the analysis involving uncalibrated radiance spectrum data and due to the parameter adjustment for the analysis method not being finalized. High concentrations are observed over continental China and Central Africa, which may be caused by measurement interference due to the presence of atmospheric dust. Asian dust (yellow sands) were observed over continental China during the observation period, and the existence of dust storm-like and smoke-like phenomena were observed in the relevant locations in Africa. Future investigation is required to understand these errors. Data calibration, processing parameter adjustment, and product validation required for quantitative discussion of the analysis results, will be carried out in the future.
(Note 1) The analysis showed Northern Hemisphere results to be on average around 10 ppm higher than Southern Hemisphere results. An atmospheric transport model calculation predicts the difference between north and south at this time to be 2-4 ppm.
(Note 2) Southern Hemisphere values were on average approximately 17 ppm lower than the model calculation, while Northern Hemisphere latitude band average values were approximately 7-12 ppm lower.
Attachment 2:
Methane (column averaged dry air mole fraction) initial analysis (April 20-28 observation data)
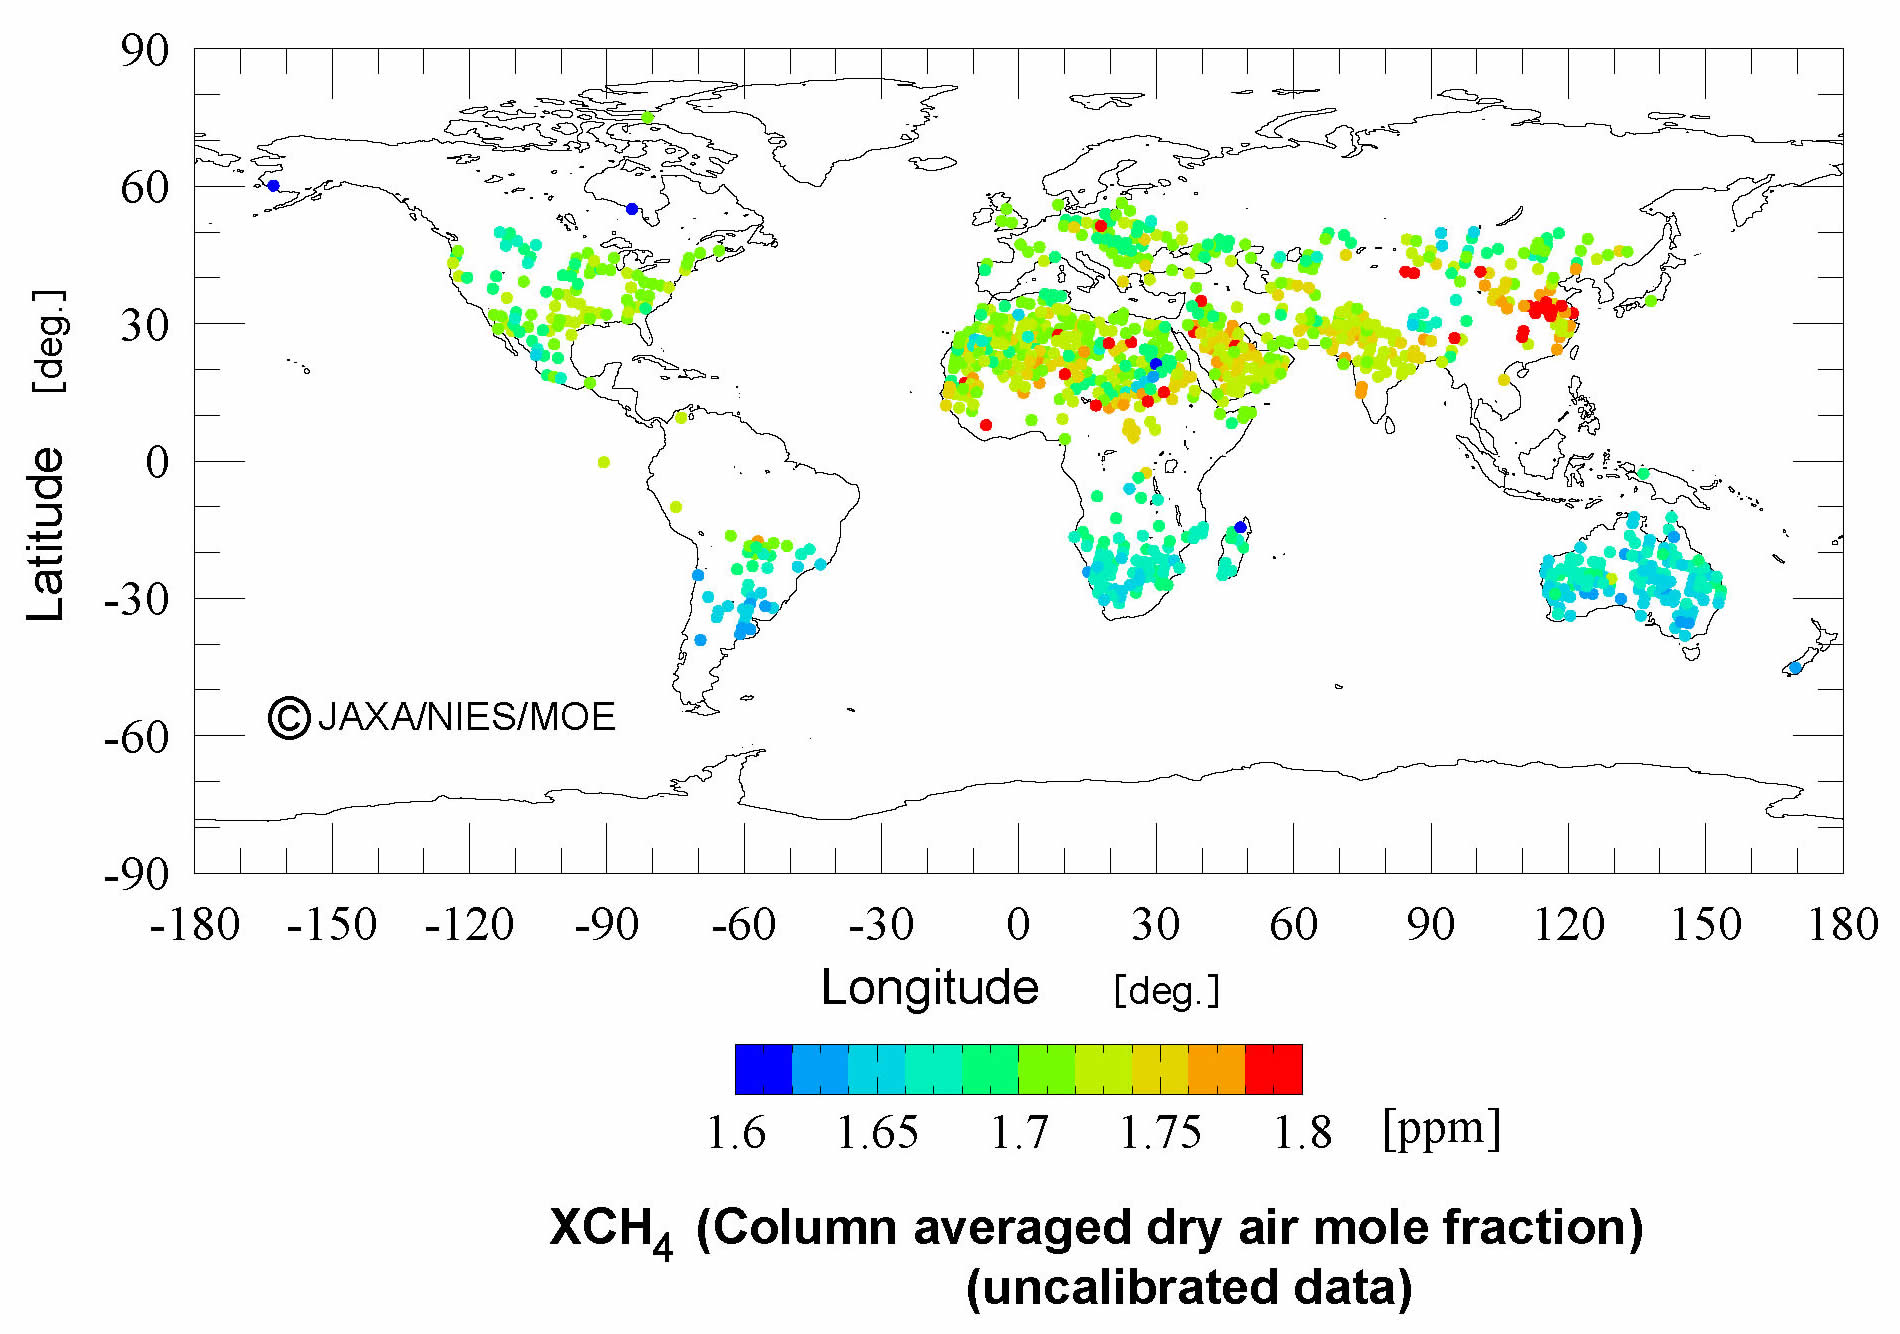
Figure: Methane column averaged dry air mole fraction (XCH4) for clear-sky scenes analyzed under the same processing conditions as Attachment 1.
In the initial analysis, the late April observation data shows a hemispheric gradient, with larger values over the Northern Hemisphere (Note 1), consistent with other measurements. Derived XCH4 values are generally lower than model predictions (Note 2). This is thought to be due to the same reasons as in Attachment 1, Data calibration, processing parameter adjustment, and product validation required for quantitative discussion of the analysis results, will be carried out in the future.
(Note 1) In the Northern Hemisphere, analysis results, that were 0.03?0.1 ppm higher in terms of latitude band average than the Southern Hemisphere, were obtained. This almost agreed with the north-south difference based on the atmospheric transport model calculation.
(Note 2) Values for the Southern Hemisphere were on average approximately 0.1 ppm lower than the model calculation, while Northern Hemisphere latitude band average values were approximately 0.04-0.13 ppm higher.
Attachment 3
Sensors on board "IBUKI", Greenhouse gases Observing SATellite (GOSAT)
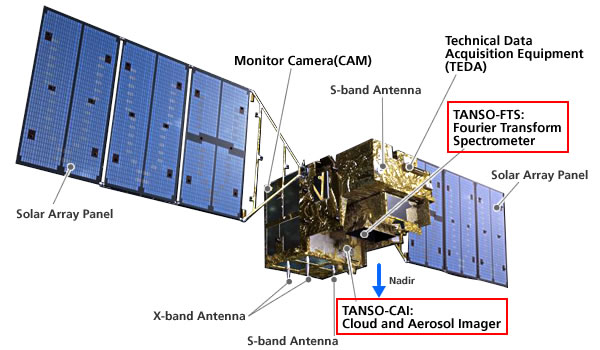
The measurement of CO2 and CH4 is taken with Thermal And Near-infrared Sensor for carbon Observation - Fourier Transform Spectrometer (TANSO-FTS).
Thermal And Near-infrared Sensor for carbon Observation - Cloud and Aerosol Imager (TANSO-CAI) observes clouds and aerosols that would interfere the greenhouse gas measurement.