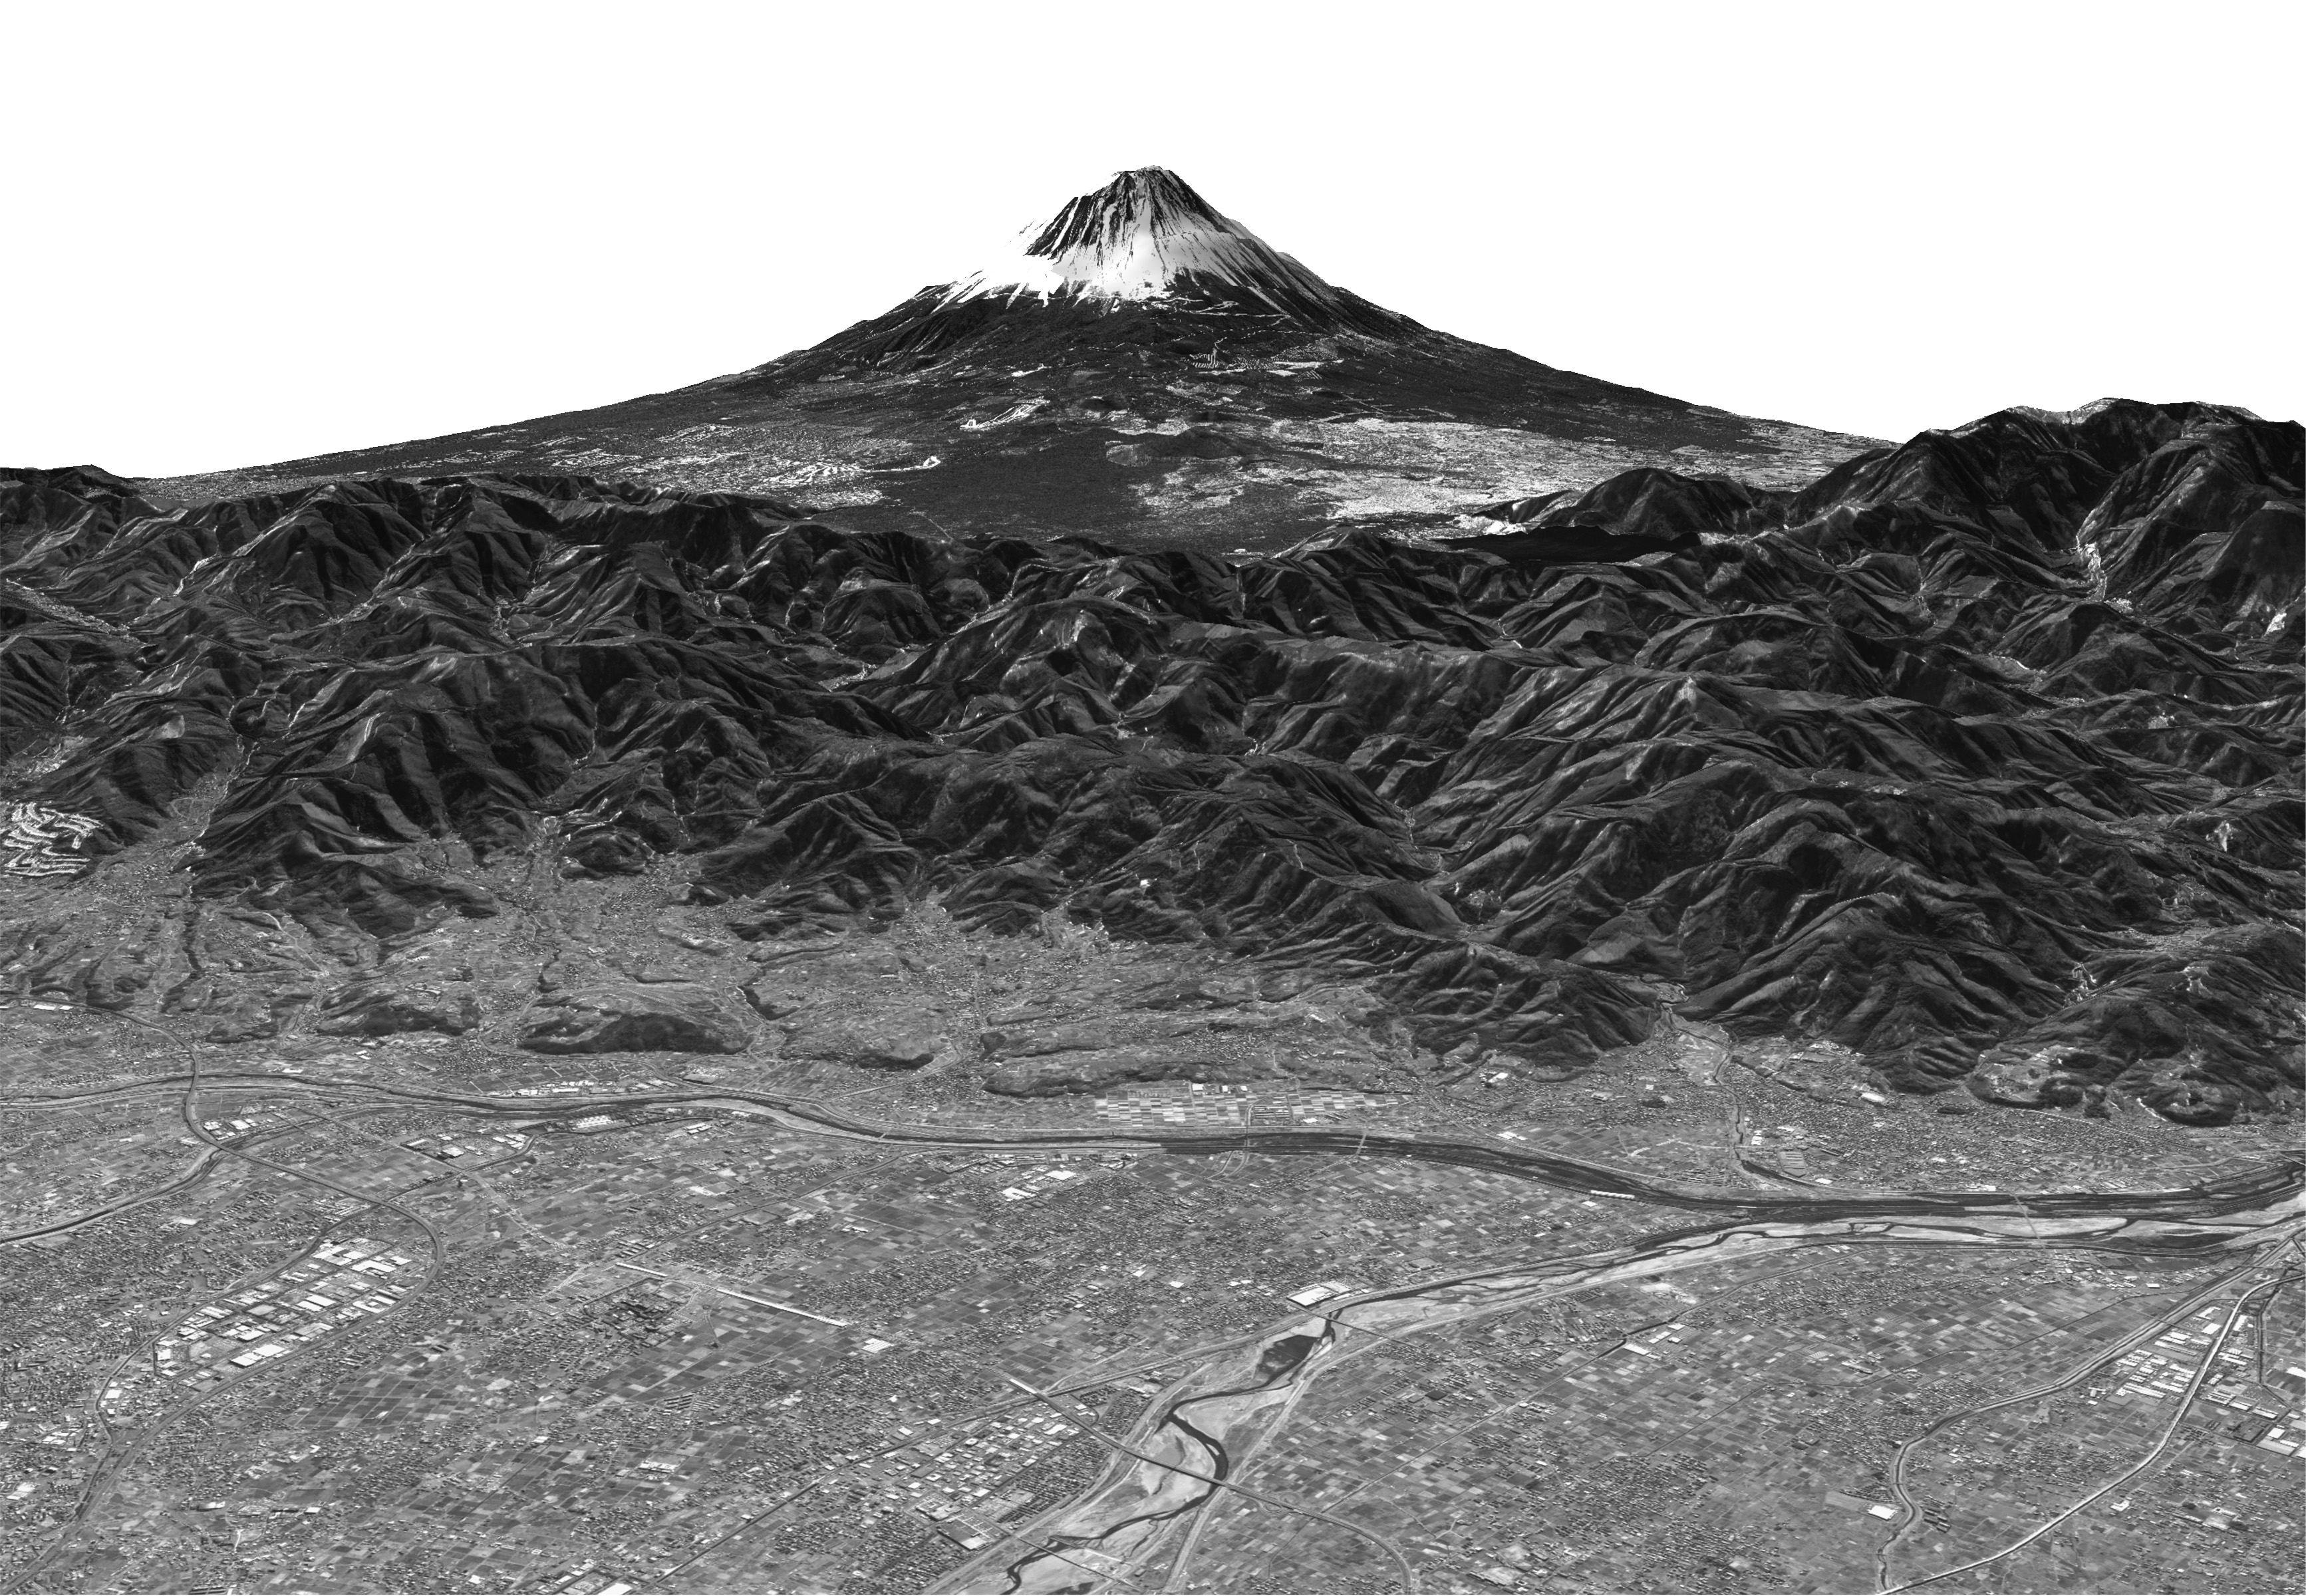
 Mt. Fuji observed by Daichi |
Q. Daichi's first image, published on February 15, 2006, was of Mt. Fuji. It was very clear and beautiful. Did you always plan to have Mt. Fuji in the first image?
Not really. We knew we wanted something with impact for the first presentation, but never expected it would turn out so beautifully, because the mountain is often covered by clouds and the chance of getting a clear image of it is only about one in five. That day, PRISM started observation when Daichi was reaching the Oga Peninsula in Akita prefecture, and the sky was completely cloudless over Niigata prefecture. Then, Daichi continued flying south over Mt. Fuji and the Izu Peninsula. Clouds didn't appear again until the satellite reached the ocean. The image was taken by PRISM during the day on February 14, just one day before its publication. We were able to show it to the public so soon because there was very little distortion. It has been more than six months since we began operation of Daichi, but we haven't got a better image of Mt. Fuji than that first one, which I found very moving when I saw it for the first time.
Q. What is the most impressive image taken by Daichi so far?
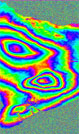
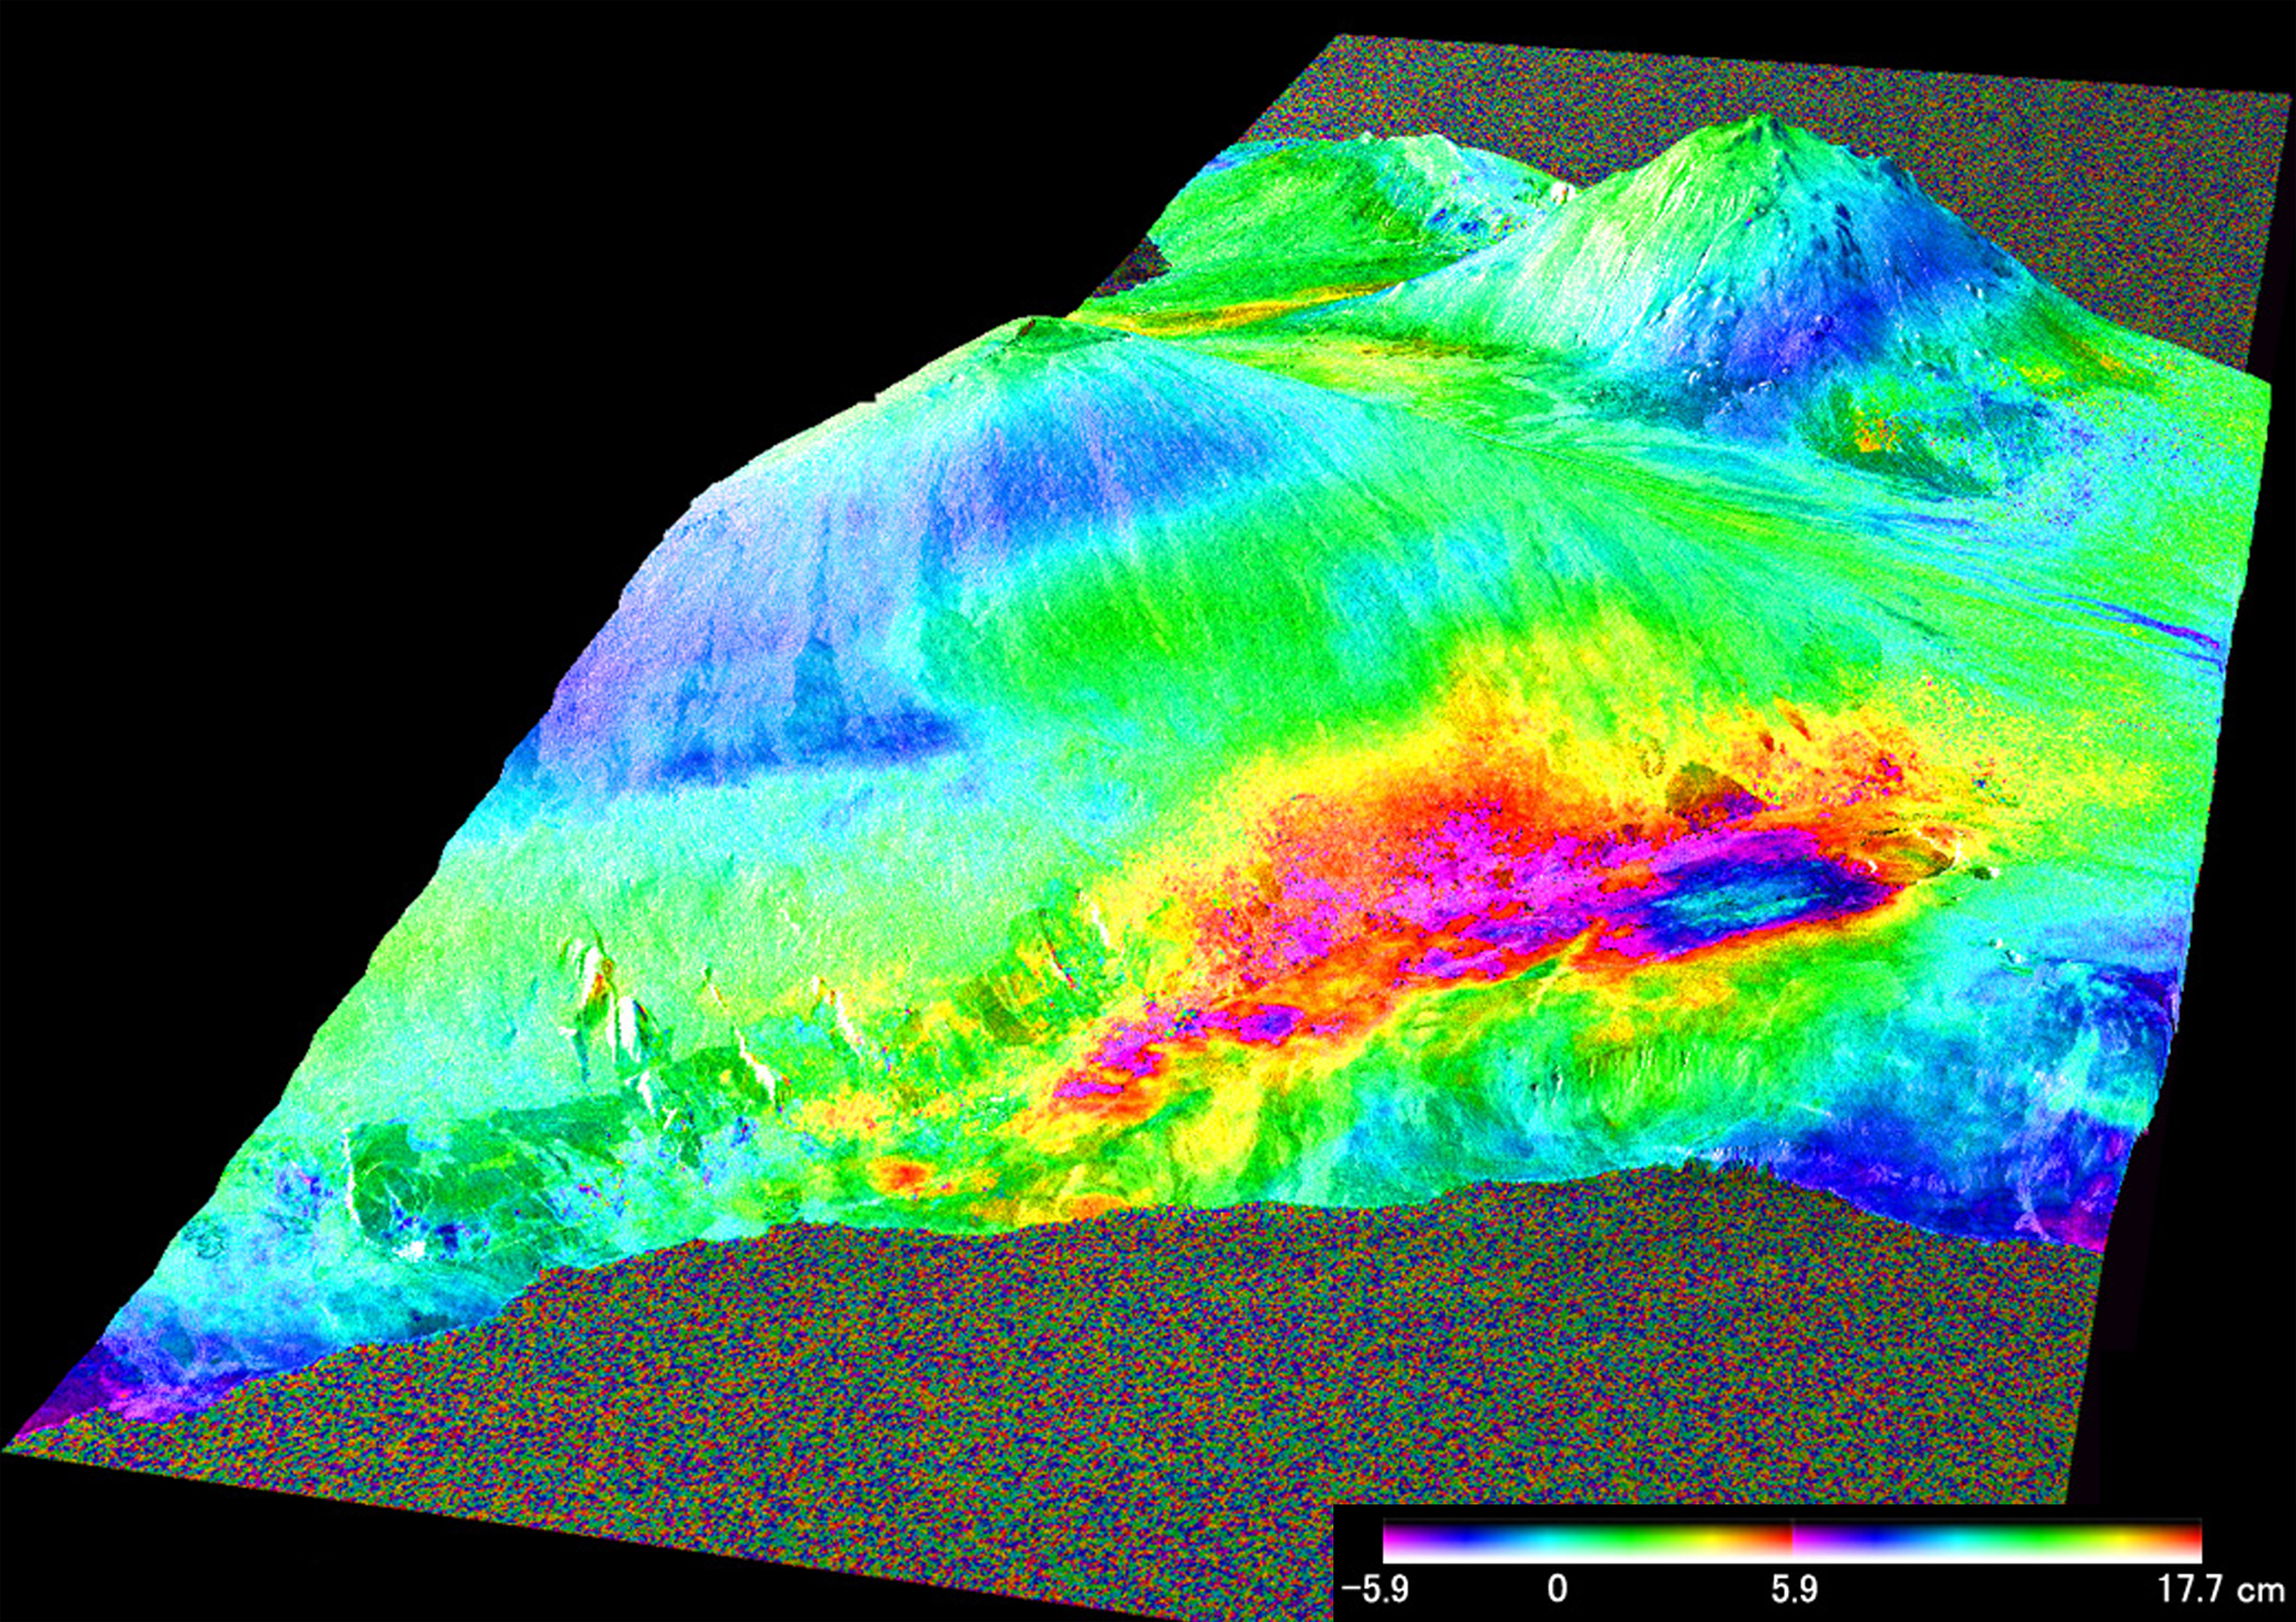 (Figure 1) Detection of a rise around Kilauea Caldera, Hawaii Island, by PALSAR |
||
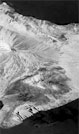
 (Figure 2) Raw PALSAR data from Hawaii on August 2, 2006 (Figure 2) Raw PALSAR data from Hawaii on August 2, 2006 (Figure 3) Figure 2 as a compressed image from Hawaii on August 2, 2006 (Figure 3) Figure 2 as a compressed image from Hawaii on August 2, 2006
 (Figure 5) Differential phase image of altitudes of the location in Figure 2 (Figure 5) Differential phase image of altitudes of the location in Figure 2 |
It is the image of a recent rise in the Earth's crust around Kilauea Caldera, on Hawaii Island, which was the first image taken by PALSAR (Figure 1). We regularly monitor the circum-Pacific orogeny [the process of mountain-building], which includes Japan, because there are frequent earthquakes and volcanic activities, and the image allowed us to confirm the existence of this rise, which was caused by magma activity.
ALOS passes the same spot every 46 days, so when the distance between an observed spot and the satellite differs from the previous measurement, it indicates that there has been a crustal movement. And with differential interferometric processing, which calculates the differences between images, we found that an area 5 meters in diameter in the southwest of the Kilauea crater rose about 10 cm in three months from May 2 to August 2, 2006. This is an area where crustal movement often occurs, and the Hawaii Volcano Observatory had also observed the rise, using their GPS.
Our observation was made with PALSAR, which is a synthetic aperture radar that uses the L-band frequency. A major feature of the L-band is that the radio waves penetrate trees and reach the ground, and the reflective signals are sent back to satellites. This makes it possible to measure the distance between a satellite and the surface of the Earth even when it's covered with trees. The L-band is also used for GPS car-navigation systems, which is why a car's location (latitude and longitude) can be confirmed even when it is driving through a forest.
This image shows the changes in detail in two dimensions. Yellow-green in an image indicates that there has been no change on the surface, red shows a rise, and blue shows subsidence, or sinking.
There are three reasons I think this is the most impressive image. First, we were able to confirm the reliability of the PALSAR interferometric technique, a goal since the completion of the JERS-1 satellite mission, which employed similar techniques. Second, there were performance problems with PALSAR at first, which took us a month to fix. And third, it turned out that we were lucky to acquire sufficient data to analyze the crustal movement, because it was not a suitable operational period for PALSAR interferometry. In fact, the raw data looks to be nothing more than noise (Figure 2). When EORC receives data from a satellite optical sensor, it is already an “image.” SAR data, on the other hand, needs compression processing for noisy signal for generating an image.
I mentioned earlier that we compare the differences in data from the same spot taken at different times. This is not something we can do with the naked eye, but only with further processing to reveal changes in the surface. Each satellite has a different parameter (a numerical value to operate an application), so to find the right one for this procedure, we went through about 300 processing tests - tuning, debugging, improving, and checking the programming. The result is a testament to our efforts towards getting an effective image (Figures 3, 4, and 5).
Q. Observable wavelengths and the resolution of images are determined by observation instruments on satellites, but do analysts have techniques to make these images more effective?
Yes, we do. It's difficult to detect changes in observational targets accurately, so having analysis techniques is essential. For instance, for diastrophism analysis, it takes a number of processing procedures to get an image. But the quality of the data signal degrades each time it's processed. So you have to have the skill to precisely extract only the necessary information without the quality being degraded. The technique differs depending on the features of the satellite and the sensors. Also, after launch, if necessary, we add new processing and analysis functions (filter processing) based on the data we receive.
PALSAR uses radio waves, but these are refracted by the ionosphere, water vapor, and air. The refractive index also varies depending on weather, and different conditions can create the illusion that the Earth's surface has risen even if nothing at all has happened. To solve this problem, we use numerical forecasting of the distribution of pressure and water vapor, and of the status of the atmosphere. And if we still can't correct it, we rely on our experience. The earlier image of a diastrophism is a result of these kinds of procedures.
| 1 2 3 4 |