Early observation results of the Advanced Microwave Scanning Radiometer 3 (AMSR3) onboard the Global Observing SATellite for Greenhouse gases and Water cycle “IBUKI GW” (GOSAT-GW)
September 5, 2025 (JST)
Japan Aerospace Exploration Agency
The Global Observing SATellite for Greenhouse gases and Water cycle “IBUKI GW” (GOSAT-GW)*1 was successfully launched on June 29, 2025 (Japan Standard Time) and entered its nominal operational orbit on July 20. Antenna of the Advanced Microwave Scanning Radiometer 3 (AMSR3)*2, which is one of mission payloads, was set to rotate at a speed of 40 revolutions per minute to ensure stable observations, and AMSR3 started collecting observation data*3 as part of the satellite’s initial functional verification operations activity*4 since August 11.
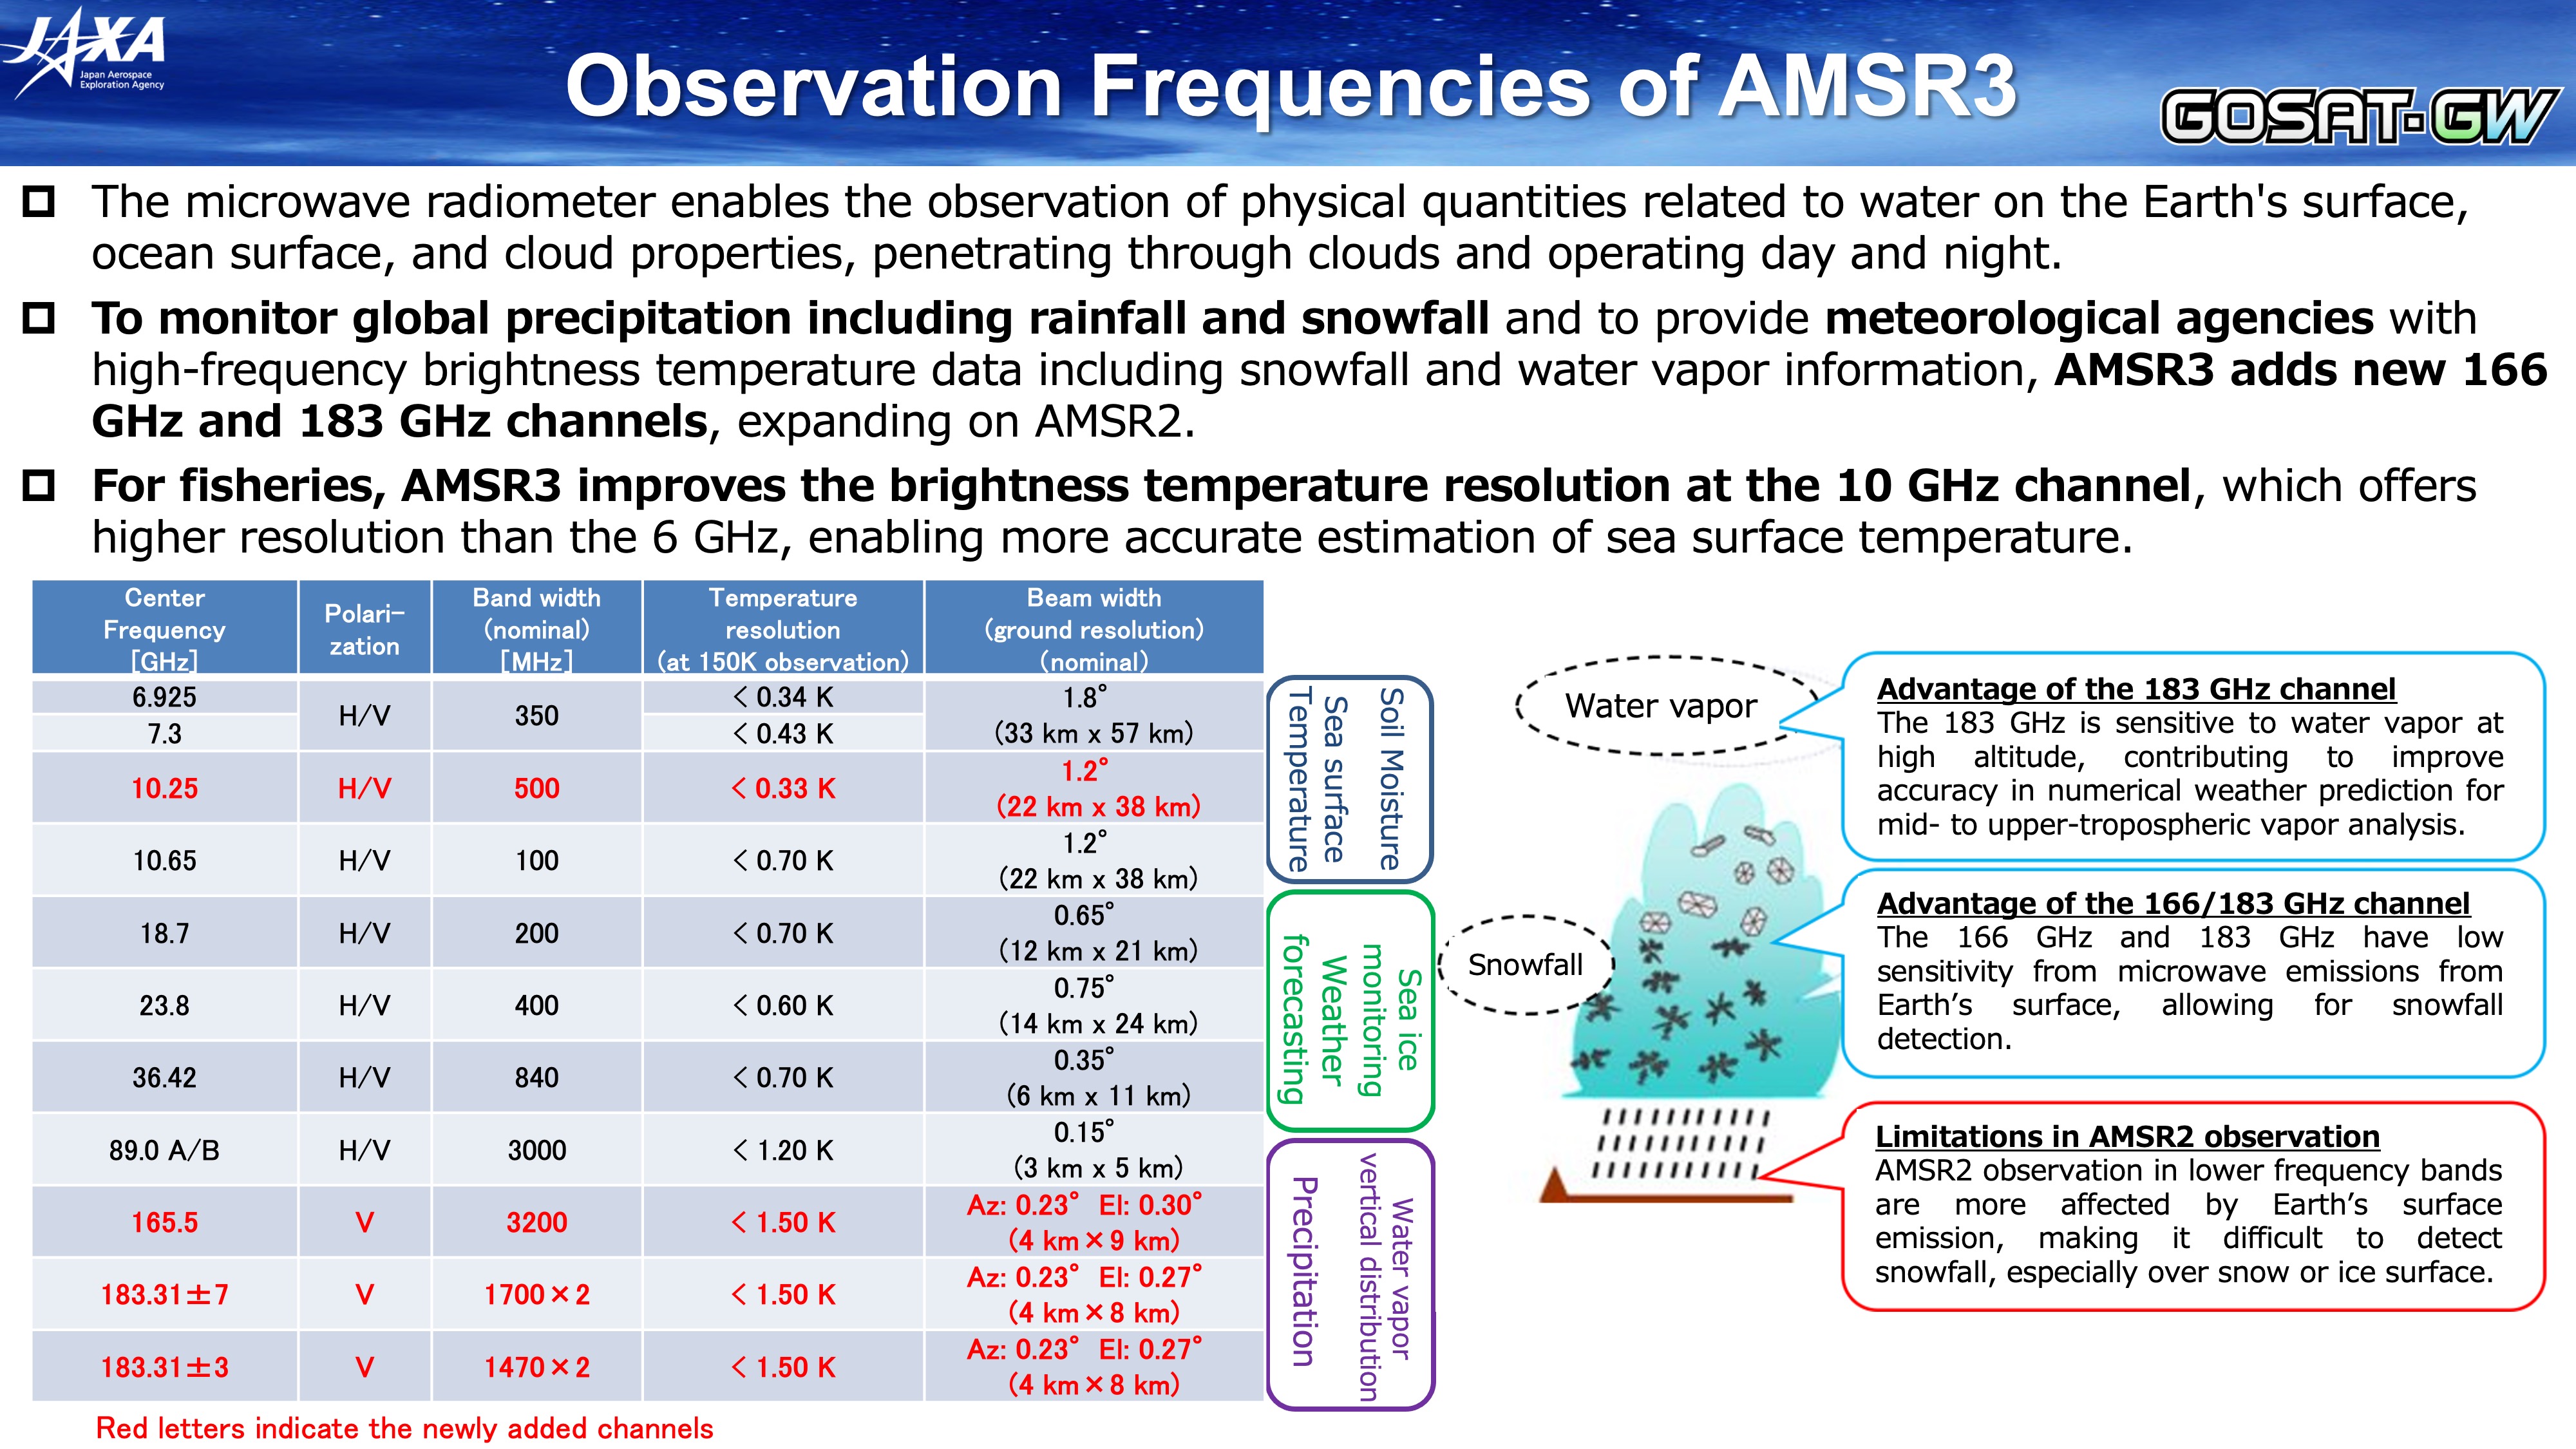
The Advanced Microwave Scanning Radiometer (AMSR) series is a sensor to observe weak microwaves naturally emitted and/or scattered from the land and ocean surfaces and in the atmosphere. Since it can estimate various water-related geophysical parameters, including sea surface temperature and precipitation, its observation data contributes to wide areas, which are operational utilization for weather forecasting, fisheries, safe ship navigation, etc., as well as monitoring of global water cycle variation and climate change. AMSR3 succeeds continuous observations by AMSR-E on board the US Aqua satellite, launched in 2002, and AMSR2 on board the GCOM-W satellite, launched in 2012, and has additional five new channels (see Figure 1, to be more precise, 10.3 GHz Vertical Polarization (V-Pol.) and Horizontal Polarization (H-Pol.)*5, and V-Pol. of 165.5, 183.3±7 and 183.3±3 GHz).
Previous microwave radiometers including AMSR2 have difficulty in observing snowfall in high-latitudes, however, observation channels of 165.5 to 183.3 GHz newly added to AMSR3 enables to estimate complete view of global precipitation (both rain and snow) including high-latitudes in detail. Furthermore, those channels can also provide water vapor profile information, which is important for weather forecasting. This is expected to contribute to improving the forecast accuracy of heavy rainfall and extent, track and intensity changes of tropical cyclones. Also, additional observation channels in 10 GHz with improved temperature resolution and reduced noises help to produce robust sea surface temperature, which is utilized in fisheries, in higher spatial resolution.
© JAXA
Figure 1:Observation frequencies of AMSR3
Reference: JAXA Satellite Navigator’s “IBUKI GW” (GOSAT-GW) web site“AMSR3 will provide further continuous observation of water-related information and will have new observation channels”
Figure 2 presents a global observation image captured by AMSR3
onboard “IBUKI GW” (GOSAT-GW,) emphasizing cloud and precipitation regions across the planet. Figure 3 shows detailed observation of the Arctic region, also obtained by AMSR3, highlighting
environmental features specific to high-latitude areas.
In addition, Appendix includes the following observation images for reference:
• Figure 4: Data from AMSR3’s 21 observation channels
• Figure 5: AMSR3 sea surface temperature observations
• Figure 6: AMSR3 sea ice observations in both the Arctic and Antarctic regions
© JAXA
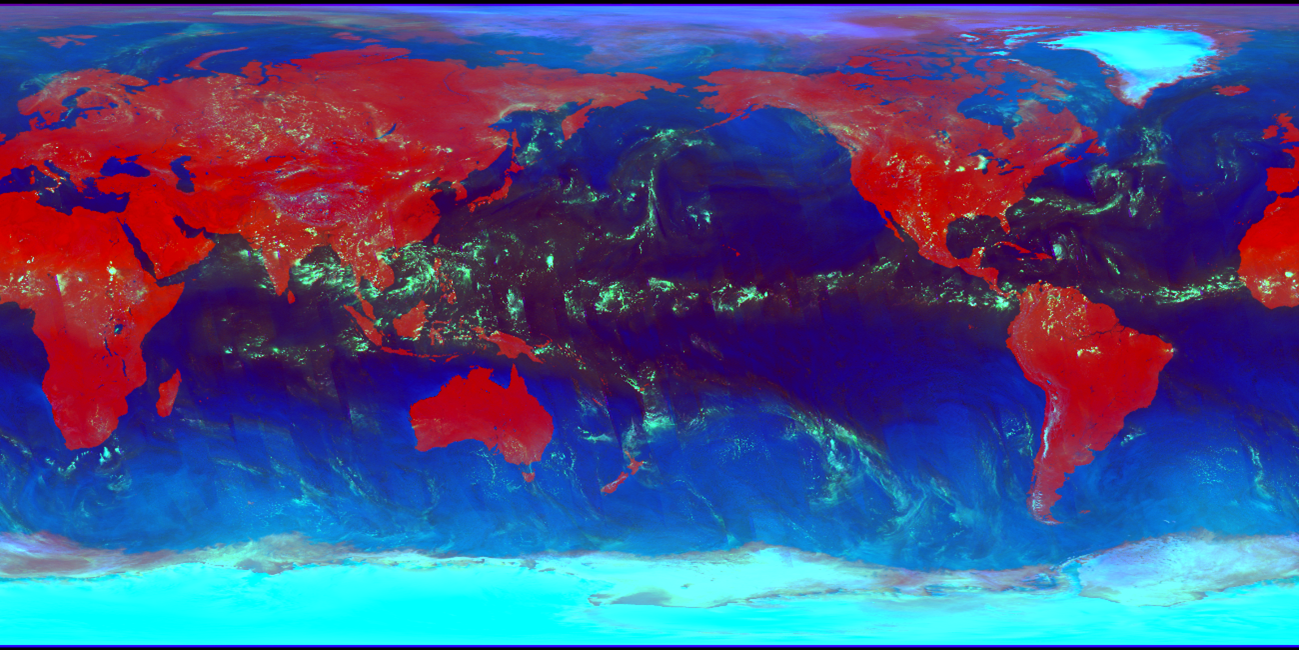
Figure 2:AMSR3 global observation image highlighting cloud and precipitation areas in light green (RGB composite image using 18.7, 89.0, and 165,5 GHz V-Pol. brightness temperature averaging data of ascending paths*6 from August 15 to 17, 2025)
Figure 2 is RGB composite image of AMSR3 observation data from August 15 to 17, 2025 by assigning data of 18.7 GHz V-Pol., 89.0 GHz V-Pol., and 165.5 GHz V-Pol. to three primary colors (red (R), blue (B) and green (G), respectively), in visually understandable way. Clouds and precipitation areas are especially highlighted with light green in this composite image. Since the 165.5 GHz channel, newly added to AMSR3 and used in Figure 2, can capture signals from ice particles in the upper layer of clouds, AMSR3 can observe clouds and precipitation areas in more detail. AMSR3 has about 1500 km swath width and covers 99.9 % of the whole Earth’s surface within 3 days as shown in Figure 2. Thus, AMSR3 can be considered the world’s best advanced microwave radiometer thanks to its ability of large area coverage in short-term, high-spatial resolution resulted by large antenna, and multiple observation channels covering low-to-high frequency bands.
© JAXA
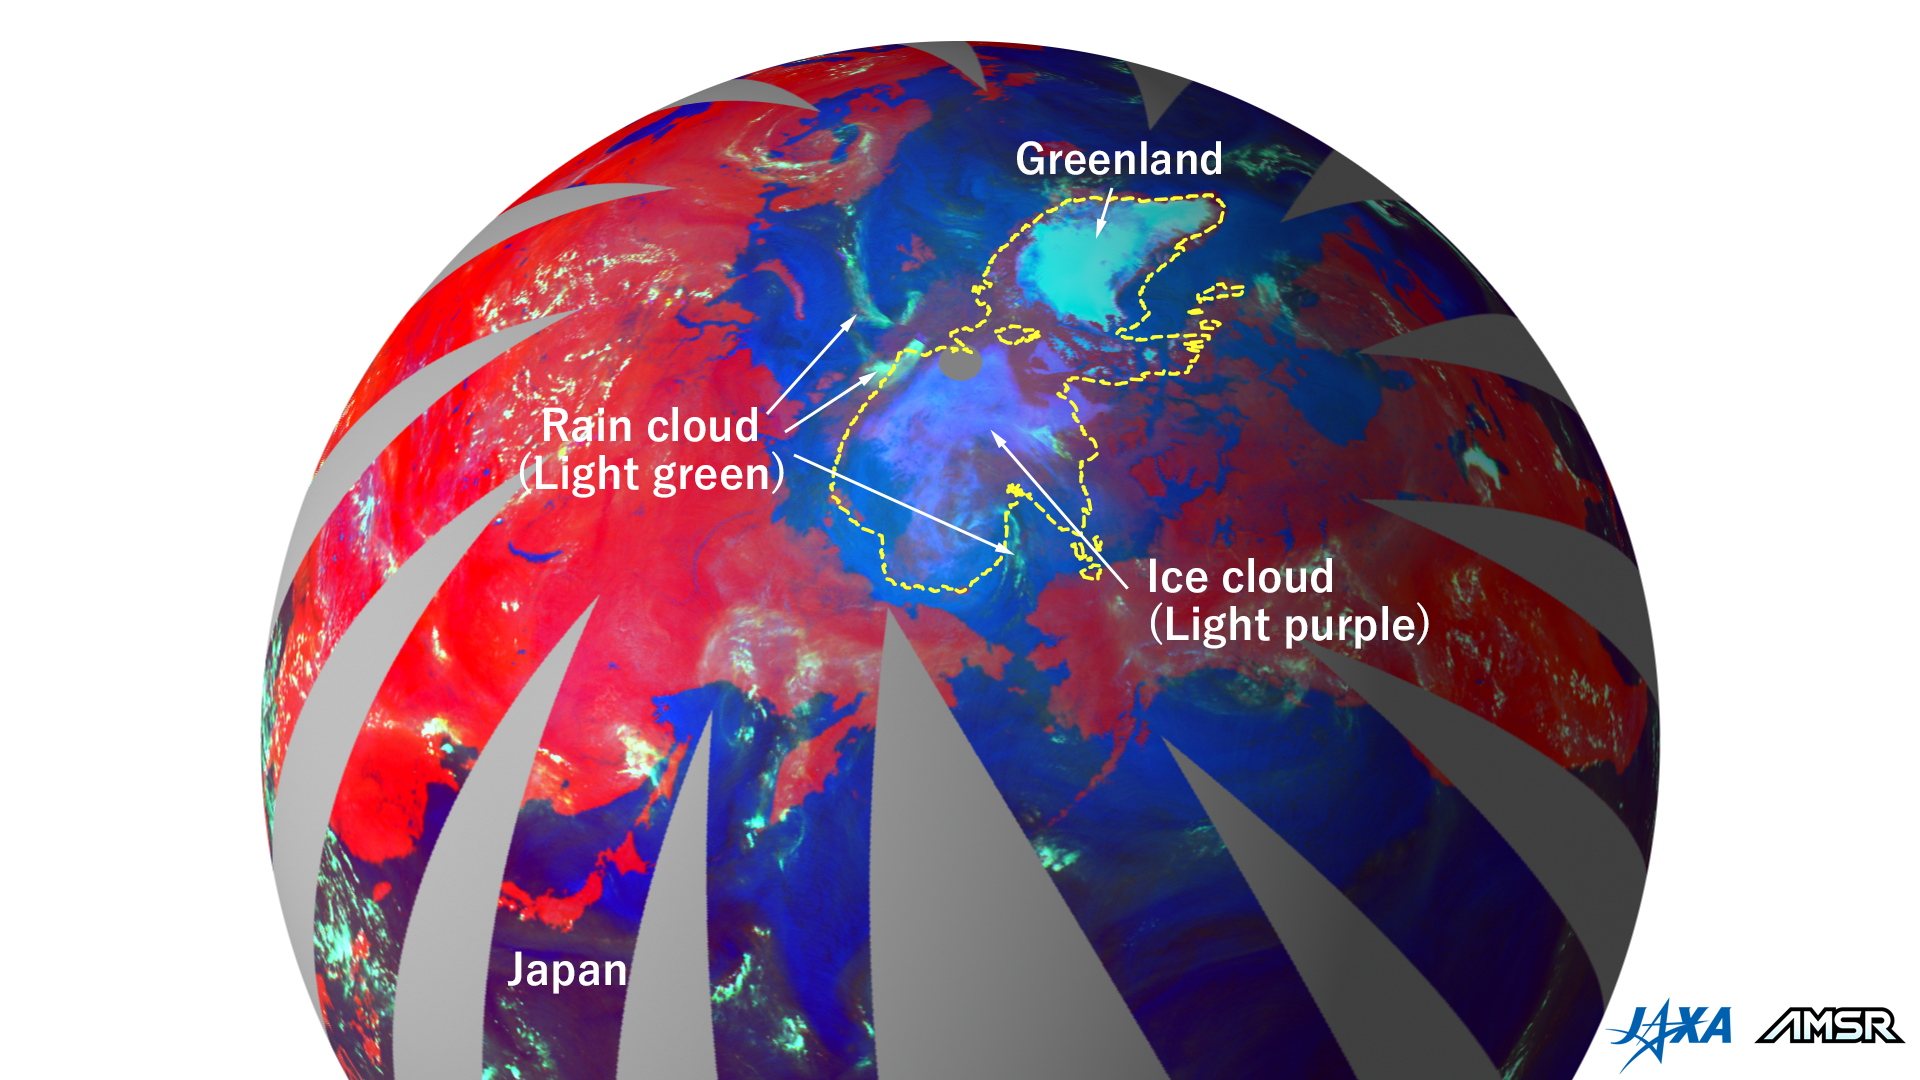
Figure 3:AMSR3 observation image focusing on the Arctic highlighting cloud and precipitation areas in light green (RGB composite image using 18.7, 89.0, and 165.5 GHz V-Pol. brightness temperature of ascending paths on August 16, 2025)
Observation channels of 165.5, 183.3±7 and 183.3±3 GHz (here after called as “high-frequency channels”) are newly added to AMSR3, and they have more sensitivity to ice particles floating inside clouds, surface snowfall and water vapor in mid-to-high layers in the atmosphere compared to observation channels available in the previous sensor, AMSR2. Figure 3 shows RGB composite image focusing on the Arctic on August 16, 2025 (ascending path) using same composite method as Figure 2. To retrieve precipitation, atmospheric analysis data, such as air temperature and water vapor, are used as reference, and precipitation inside yellow dot-line is determined as snowfall and that on outside is determined as rain in this case. In fact, clouds and precipitation have appeared differently in the RGB composite image of Figure 3. Light purple areas inside the yellow dot-line seem to be ice clouds consisting of ice particles (ice crystal and snow) mainly, and light green areas outside are supposed to be rain clouds with rich water particles (cloud droplet, rain). Please note that for Greenland, environmental conditions such as elevation and surface temperature differ from those over sea ice. Consequently, in this RGB composite image, the land surface appears bright blue, making cloud identification difficult. By utilizing high-frequency channel observations in AMSR3, it becomes possible to obtain information on cloud properties (water or ice) and snowfall beneath clouds, which cannot be captured by AMSR2.
JAXA, in collaboration with the prime contractor Mitsubishi Electric Corporation and various partner companies involved in satellite operations, is currently conducting a three-month initial functional verification phase.
During this period, it is being confirmed that the satellite “IBUKI GW” (GOSAT-GW) and its onboard sensors are operating nominally as expected. Upon successful verification, JAXA will conduct the initial calibration and validation of the observational data and make transition to the nominal observation operation.
For the calibration and validation of AMSR3, JAXA will verify the product accuracy in cooperation with AMSR2 and the JAXA’s Global Satellite Mapping of Precipitation (GSMaP)*7, which will use AMSR3 data as input.
*1
“IBUKI GW” (GOSAT-GW: Global Observing SATellite for Greenhouse gases and Water cycle) is an Earth observation satellite designed to monitor greenhouse gases and the global water cycle from space. The satellite is equipped with two advanced mission instruments: the Advanced Microwave Scanning Radiometer 3 (AMSR3), which observes water-related parameters such as precipitation, sea surface temperature, and sea ice; and the Total Anthropogenic and Natural emissions mapping SpectrOmeter-3 (TANSO-3), which measures greenhouse gas concentrations with high precision. These instruments enable comprehensive monitoring of Earth’s climate and environmental changes.
*2
AMSR3
AMSR3 is the is the latest sensor of the “AMSR series”, which has started from AMSR-E on board the U.S. Aqua satellite launched in 2002, to succeed “observation of water-related variables on the Earth” for more than 23 years. The AMSR series is a series of Japanese microwave radiometer that has world’s best capability by its frequent observation, higher spatial resolution by large antenna and observation channels covering low-to-high frequencies. By observing weak microwaves naturally emitted and/or scattered from the land and ocean surfaces and in the atmosphere, it can observe sea surface temperature, sea surface wind speed, precipitation, soil moisture, snow depth, sea ice concentration, etc. The AMSR series contributes to various areas by utilizing its observation data in operational applications in weather forecasting, fisheries and safety ship navigation as well as monitoring climate change, such as decreasing trend of polar sea ice extent. For more details about the AMSR series and AMSR3, please visit the AMSR web site.
*3
AMSR3 started collecting observation data
Observation data from AMSR3 onboard “IBUKI GW” (GOSAT-GW) were successfully acquired through “test signals” transmitted for verifying communication between the satellite and ground stations.
*4
Initial Functional Verification Operations activity
Following the launch of the satellite, an initial phase of operations is conducted to verify that the satellite, including its onboard sensors, is functioning as intended in orbit. This process ensures that all systems meet the required performance specifications before proceeding to subsequent calibration and data validation stages. “IBUKI GW” (GOSAT-GW) has conducted the initial functional verification operations since July 1, 2025.
*5
Vertical and Horizontal Polarization (V-Pol. and H-Pol.)
Polarization refers to the orientation of electromagnetic wave oscillations in space. In the case of an Earth observation satellite, Vertical polarization (V-Pol) indicates that the electric field oscillates in a vertical direction to the Earth’s surface, and Horizontal polarization (H-Pol) indicates oscillation in a horizontal direction. Differences in signal strength between these two polarization modes provide valuable insights into various physical properties of observed targets.
*6
Ascending Path
An ascending path refers to the satellite’s trajectory as it moves from southern regions toward northern regions. Conversely, a descending path describes its movement from north to south. For “IBUKI GW” (GOSAT-GW), observations during the ascending path occur at approximately 1:30 PM local solar time (daytime observations), while those during descending path take place around 1:30 AM local solar time (nighttime observations).
*7
The Global Satellite Mapping of Precipitation (GSMaP)
The Global Satellite Mapping of Precipitation (GSMaP) is a multi-satellite global precipitation map in 0.1-degree latitude-longitude grid and hourly developed by JAXA in collaboration with partner universities and institutes under the U.S.-Japan joint Global Precipitation Measurement (GPM) mission. GSMaP combines observation data from the Dual-frequency Precipitation Radar (DPR) on board the GPM core satellite, other GPM constellation satellites, including AMSR2 on board the “SHIZUKU” (GCOM-W) satellite and Geostationary satellites. The GSMaP data and image are available via the “JAXA Global Rainfall Watch” web site.
[Appendix]
© JAXA
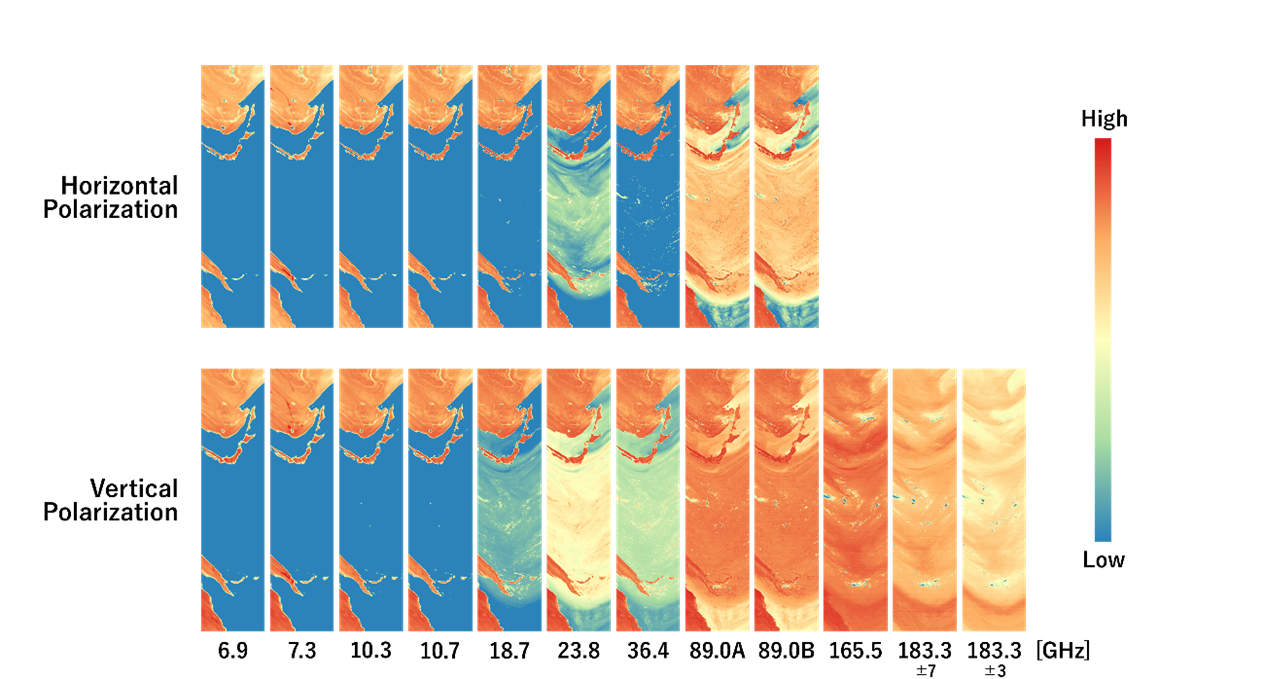
Figure 4:Observation around Japan by 21 channels equipped by AMSR3 (cropped from ascending path on August 16, 2025)
As shown in Figure 4, AMSR3 has 21 observation channels within frequency bands from 6.9 to 183.3 GHz including V-Pol. and H-Pol. to observe weak microwaves naturally emitted and/or scattered from the land and ocean surfaces and in the atmosphere. Since each frequency has different sensitivity to different geophysical parameters, it is expected to be utilized in various research and operational application areas related to the atmosphere, ocean, land and cryosphere.
© JAXA
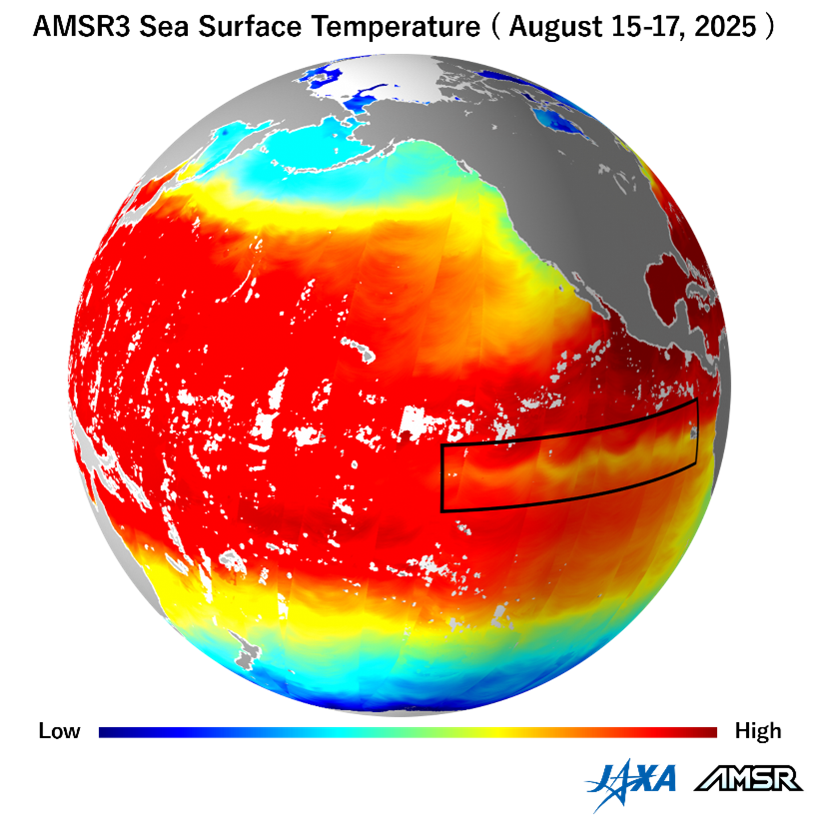
Figure 5:Sea surface temperature image observed by AMSR3 (average of descending paths from August 15 to 17, 2025)
*Light grey areas over the ocean are missing due to heavy rainfall and/or strong wind.
Since the AMSR series can obtain information under clouds both day- and night-time, it is widely used in oceanic applications. Figure 5 shows sea surface temperature distribution observed by AMSR3 descending paths from August 15 to 17, 2025 and indicates that AMSR3 successfully observes sea surface temperature over the tropical Pacific Ocean where frequently covered by clouds. Please note that light grey areas over the ocean are missing due to heavy rainfall and/or strong wind.
The region off the coast of Peru in South America, shown in black rectangle in Figure 5, is an important region where El Niño and La Niña phenomena*8, which affect weather of Japan and/or the world, are generated. In Figure 5, zonally expanded lower temperature signals (yellow-to-orange,) which are typical conditions in non-El Niño period, are well captured in the figure. Channels that have sensitivity to sea surface temperature in higher spatial resolution are enhanced in AMSR3, and further expansion of utilization in abnormal weather prediction and fisheries are expected.
© JAXA
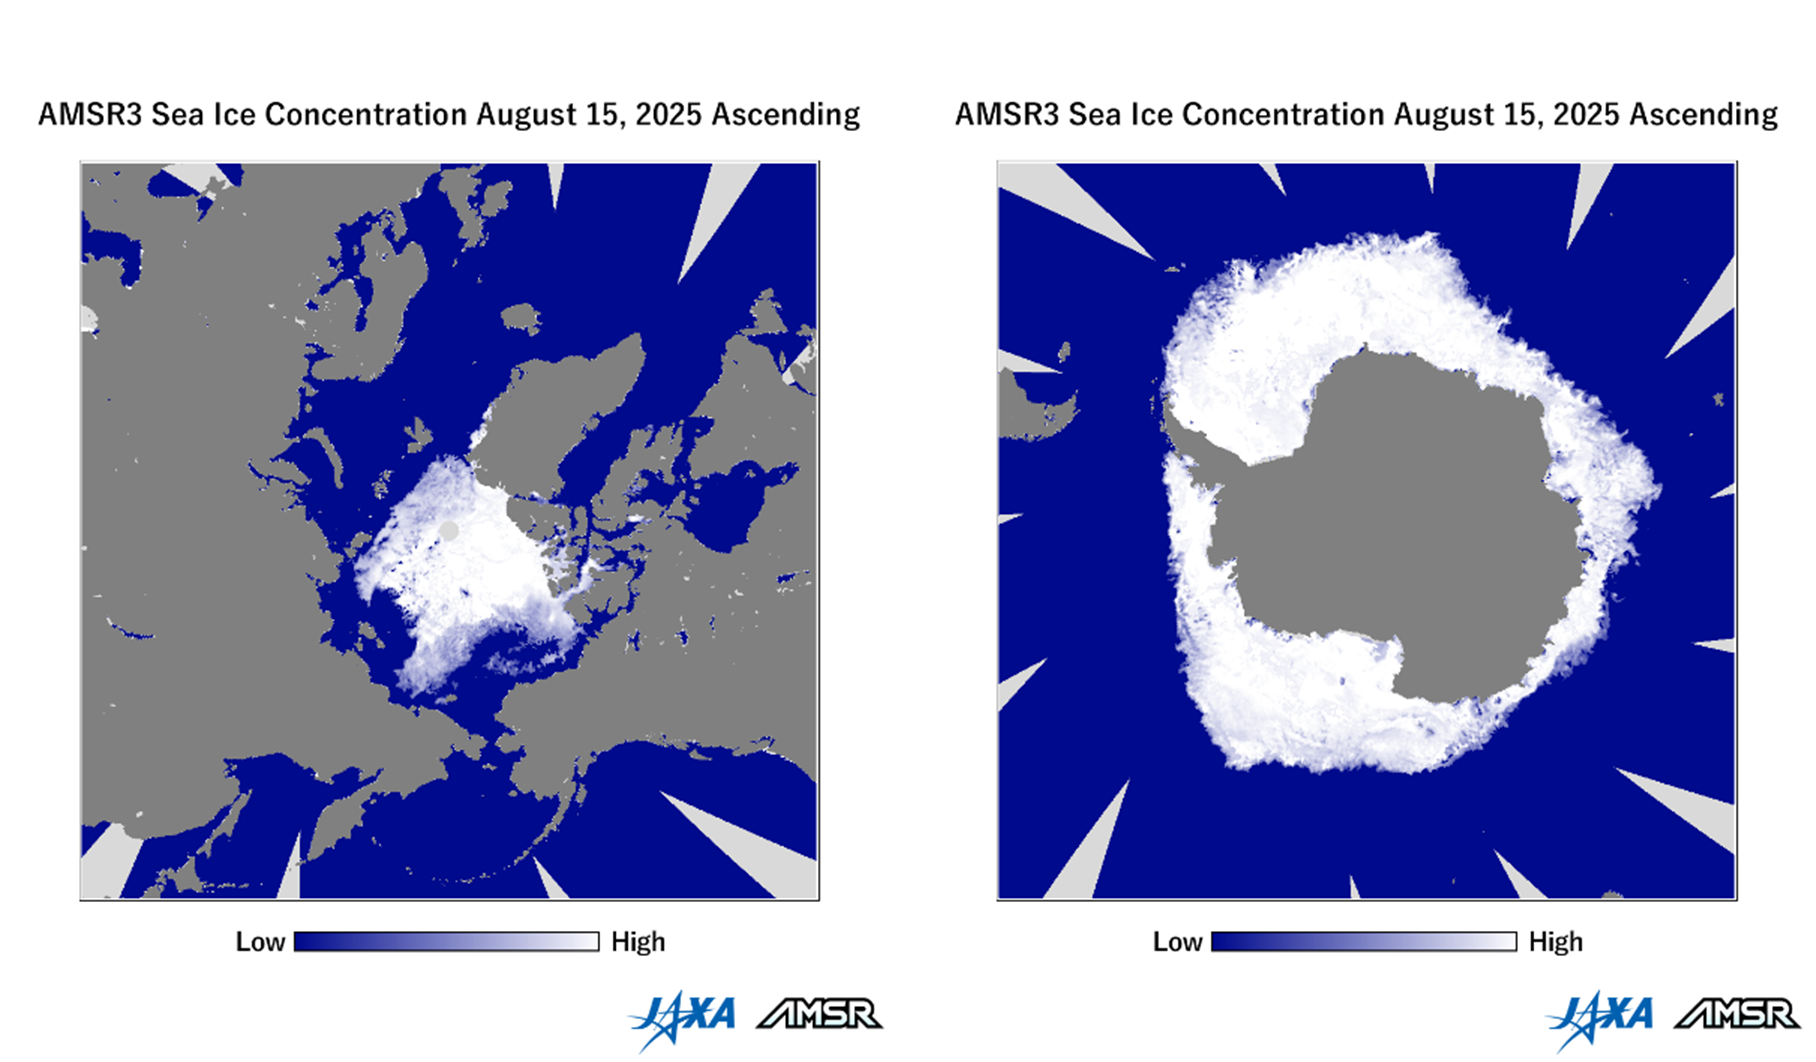
Figure 6: Sea ice observation over polar regions by AMSR3 (ascending paths on August 16, 2025. Left: Arctic sea ice distribution centered on the North Pole. Right: Antarctic sea ice distribution centered on the South Pole.)
AMSR3 can observe the Arctic and Antarctic Oceans, which are far from Japan and have difficulty in developing and maintaining in-situ observations. Sea ice covering these polar oceans is a critical and essential indicator for monitoring climate change. Figure 6 shows the sea ice distribution over the Arctic and Antarctic for ascending paths on August 15, 2025, and white-colored areas indicate sea ice extent. The Arctic region, currently in summer like Japan, is approaching the time of year when sea ice extent reaches its minimum. In contrast, the Antarctic region is midwinter and sea ice areas are spreading widely.
Space-based observations of sea ice have continued since 1978, and the AMSR series has made significant contributions to long-term and high-spatial resolution monitoring of sea ice areas since 2002. Previous observation results have revealed that the Arctic sea ice extent in summer season has decreased by almost 40 % over the past 46 years*9. Now, AMSR3, the latest microwave radiometer, will succeed to the role of sea ice monitoring and provide more detailed information on sea ice conditions by leveraging its full sensor capability. These advanced observations will contribute to continuous monitoring of climate change.
*8
El Niño and La Niña phenomena
El Niño is a phenomenon in which sea surface temperatures over the eastern equatorial Pacific Ocean become higher than normal year and remain elevated for about a year. In contrast, La Niña is a phenomenon in which sea surface temperatures in the same area remain lower than normal. Both phenomena occur in a cycle of several years. It is well known that they could be a trigger to cause abnormal weather not only in the equatorial Pacific region but also all over the world including Japan, since they globally affect position and intensity of atmospheric convection systems. Please visit JAXA El Niño Watch web site for monitoring status of El Niño and La Niña phenomena using sea surface temperature data from the AMSR series.
*9
Arctic sea ice extent in summer season has decreased by almost 40 % over the past 46 years
Arctic sea ice has been observed over the long-term using satellite-based microwave radiometers since 1978. In recent years, due to global warming, the Arctic sea ice extent has significantly decreased, with the summer extent known to have decreased by about 40 % over the past 46 years. In contrast, Antarctic sea ice extent had been expanding until 2015, but it has significantly decreased since 2016. In 2025, it reached the smallest extent in the history of satellite observations, drawing attention to its variability. For details, please refer to JAXA JASMES for sea ice.